


Contents

On-demand webinar
How Good is My Shield? An Introduction to Transfer Impedance and Shielding Effectiveness
by Karen Burnham
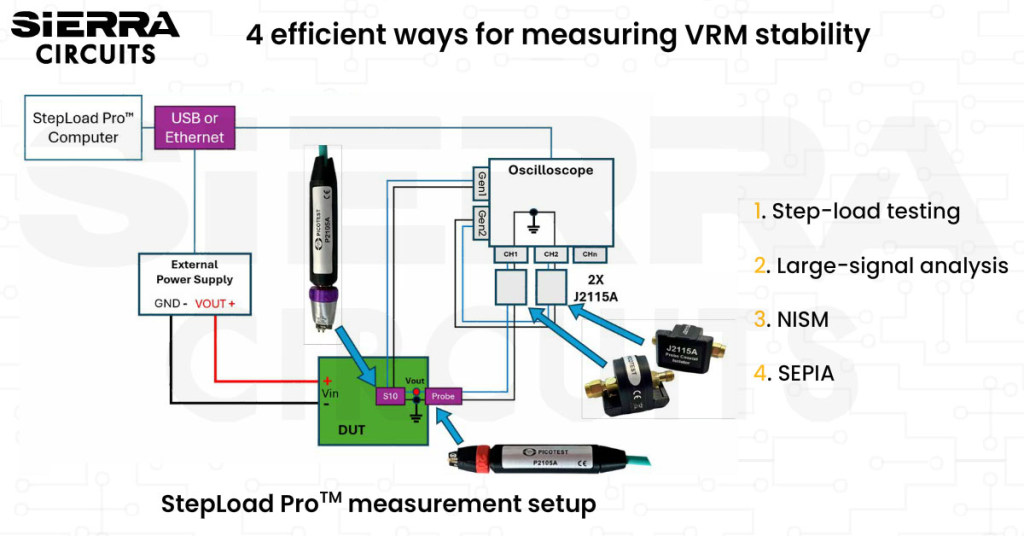
To measure the voltage regulator module (VRM) stability in PCBs, you need a combination of Bode plot analysis, step-load testing, and large-signal analysis. It also calls for advanced techniques such as non-invasive stability measurement (NISM) and scope-embedded power integrity analysis (SEPIA).
Power integrity engineers and board designers should understand these techniques to identify regulator issues early and prevent ringing, voltage droop, and unreliable power delivery.
In this article, you’ll learn why traditional Bode plots are not sufficient for advanced regulators. We’ll also cover how large-signal analysis, step-load testing, NISM, and SEPIA help identify hidden defects.
Watch the full webinar here: Stop guessing the ring: automated non-linear VRM stability in under a minute.
Highlights:
- Step-load testing reveals ringing, overshoot, undershoot, and control-loop behavior that may not be visible in traditional test methods.
- Large-signal analysis captures real-world effects such as duty-cycle saturation, inductor saturation, capacitance loss due to DC bias, and operating-point drift.
- NISM enables efficiency assessment without breaking the feedback loop, making it suitable for integrated regulators and PMICs.
- Small-signal and large-signal analyses are required to evaluate power integrity.
How to analyze VRM stability in PCBs?
Voltage regulator module integrity is calculated by identifying how effectively a control loop responds to disturbances while maintaining a stable output.
A stable module can recover from load changes without excessive circuit board ringing, oscillation, or voltage excursions, ensuring reliable power delivery to the load.
In closed-loop systems, the relationship between the open-loop and closed-loop response is expressed as:
Closed loop = Open loop / 1 + T. Where T represents the loop gain.
Why Bode plots fall short for regulator stability evaluation
Conventional measurement techniques cannot accurately evaluate complex, non-linear control loops or account for the effects of the power distribution network (PDN) under real operating conditions.
Bode plots are the standard method for evaluating power-supply efficiency as they provide insight into control-loop behavior and stability margins.
These frequency-domain measurements assess closed-loop behavior by analyzing gain and phase across a range of frequencies. Phase margin and gain margin are then used to estimate the regulator module’s performance.
This can be a challenge in modern VRMs, where control loops are often integrated, inaccessible, or non-linear. Bode plots do not fully account for the impact of the PDN, which can influence overall system proficiency.
As voltage regulator module architectures become more complex, you need to incorporate methods that evaluate the complete system response under real operating conditions.
Here’s an example:
The figure below shows the transient response of a DC-DC converter. The module exhibits a phase margin of 78° and a gain margin of 6.7 dB, suggesting stable operation.
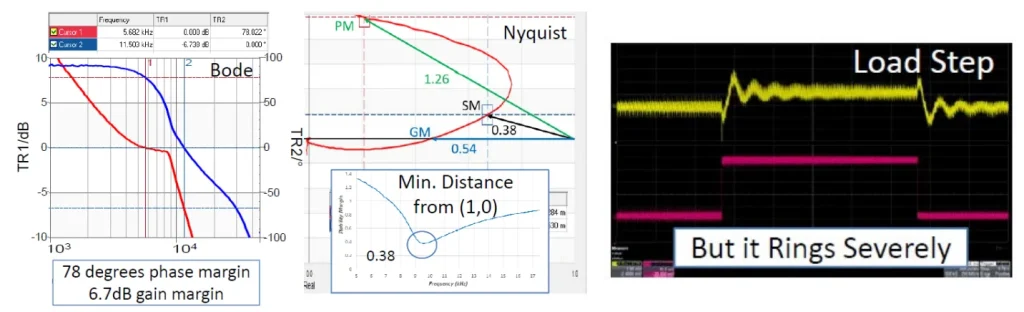
However, the same converter produces significant ringing during a load-step test. This oscillatory response indicates a potential error that is not detected by the Bode plot.
This example demonstrates that acceptable gain and phase margins do not always provide a complete picture of stability. Bode plots provide valuable insight into control-loop behavior. Having said that, they may not fully capture how a regulator responds to large load changes under real operating conditions.
As a result, engineers often supplement traditional techniques with load-step testing and large-signal analysis.
To learn how to build boards for power applications, download the High-Power Design Guide.

High-Power PCB Design Guide
12 Chapters - 96 Pages - 75 Minute ReadWhat's Inside:
- Guidelines for designing traces, planes, and vias for high current
- Material selection, stack-up, and power distribution strategies
- Thermal management techniques for power electronics
- Creepage and clearance rules based on the industry standards
- Common design mistakes and how to avoid them
Download Now
Why should you perform large-signal analysis for VRM stability measurement?
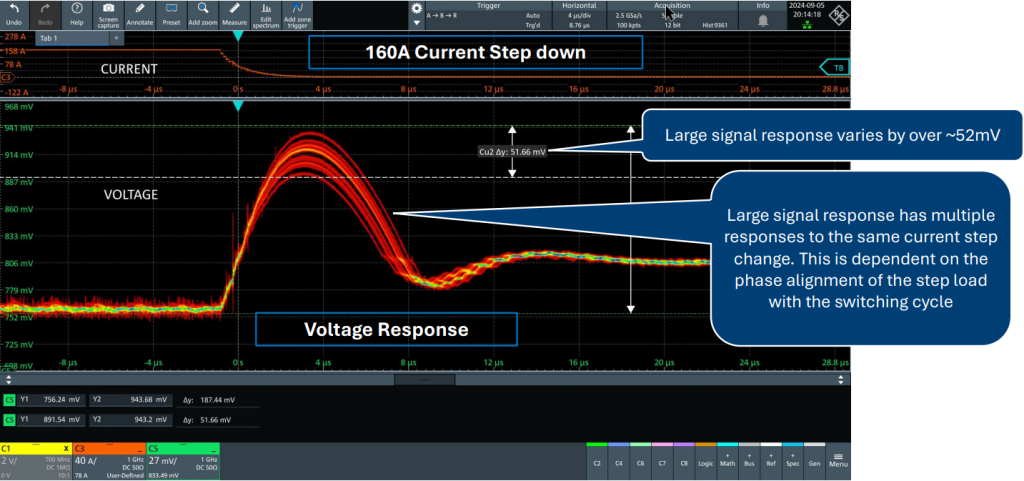
It evaluates how a voltage regulator behaves under real operating conditions, including aggressive load transients and non-linear component behavior. These effects are not captured by traditional small-signal measurements.
Large-signal analysis helps you validate the following conditions:
- Duty-cycle and slew-rate limits: Unlike linear time-invariant (LTI) models, large-signal analysis accounts for physical saturation at 0% or 100% duty cycle, revealing the actual current slew-rate capability during large load transients.
- Dynamic inductance (L): Captures inductor saturation effects where high current levels cause core saturation, leading to a sharp drop in inductance and potential current runaway.
- Voltage-dependent capacitance (C): Validates stability against AC/DC-bias effects, accounting for the significant loss of effective capacitance in ceramic filters as the operating voltage increases.
- Operating point drifting: Identifies unstable zones where a system tuned for low-power (small-signal) becomes inefficient at high-power due to shifting component values.
- Non-linear responses: Uses large-scale transients to stress-test the system beyond the “linear wiggle,” ensuring the converter doesn’t oscillate when pushed to its physical design ceilings.
Comparing small- and large-signal measurements shows why both are essential for evaluating VRM stability in PCBs. Small-signal measurements predict behavior around a steady operating point. Large-signal measurements reveal how the VRM responds to real-world load transients and non-linear effects.
Large signal vs. small signal analysis
| Parameter | Small-signal measurement | Large-signal measurement |
|---|---|---|
| Focus | Relatively constant signals with small variations | Phenomena involving significant changes in operating conditions |
| What it measures | Impedance, PSRR, Bode plots | Transient and step responses, voltage droop, and power delivery during peak demand |
| Operating conditions | Near-linear operation with small signal variations | Real-world operating conditions with large load changes |
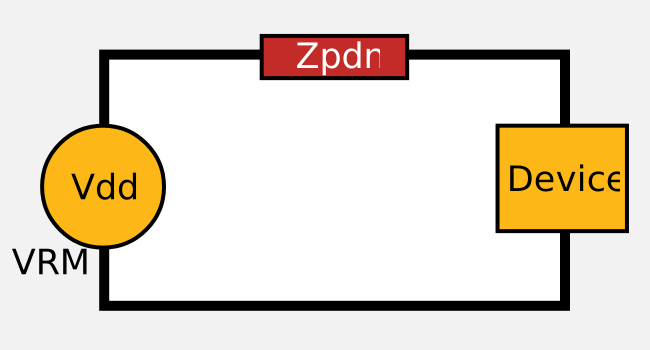
Power integrity includes everything from the power supply to the load. Therefore, PDN evaluation requires both small-signal and large-signal measurements.

Why is step-load testing essential for VRM stability validation in PCBs?
Step-load analysis evaluates how a regulator module responds to sudden changes in current demand. By applying an abrupt load transient, it acts as a system stress test, exposing transient behavior, control-loop limitations, and power-delivery issues under realistic operating conditions.
Specifically, it helps you:
Excites a wide frequency range
A near-instantaneous load step behaves like a mathematical impulse, forcing the controller to respond across its entire frequency range during a single event. This makes step-load testing an efficient way to evaluate overall system response without performing multiple measurements.
Triggers non-linear transitions
Large load steps intentionally push the module beyond its normal operating region, forcing transitions between operating modes such as continuous conduction mode (CCM) and discontinuous conduction mode (DCM). These transitions can reveal behaviors that may not be visible during small-signal testing.
Exposes control saturation
While small-signal measurements keep the controller within its linear operating range, a step load can drive the regulator toward physical limits such as 0% or 100% duty cycle. This helps engineers evaluate how effectively the system recovers after reaching these limits.
Measures peak deviation (safe operating area)
Step-load testing provides a direct way to measure voltage overshoot and undershoot during transient events. These measurements help verify that the output voltage remains within the safe operating limits of sensitive downstream devices.
Real-world examples:
Step loads simulate actual system behavior, such as a CPU waking from sleep or a radio turning on. These events are among the most common causes of power-rail failure, making step-load testing a practical benchmark for evaluating a VRM.
For more details on regulator analysis, book a meeting with our experts or call us at +1 (800) 763-7503.
What is NISM?
Non-invasive stability measurement is a method of determining control loop stability margins without requiring access to the feedback loop. This technique was developed by Steve Sandler, founder and CEO of Picotest. It uses two-port impedance measurements to evaluate control loop behavior across a wide range of power systems.
This can be applied to point-of-load (POL) regulators, fixed-voltage regulators, integrated circuits, and other systems with a control loop. It works for both linear time-invariant (LTI) and non-LTI systems.
The technique works by computing the group delay from the impedance measurements. Next, the Q factor is derived and used to determine the system’s stability margin. This enables engineers to evaluate the regulator’s behavior without requiring access to the control loop.
During the live webinar, Ben demonstrated how NISM can identify regulator issues.
All these boards come from different vendors and exhibit distinct impedance responses.
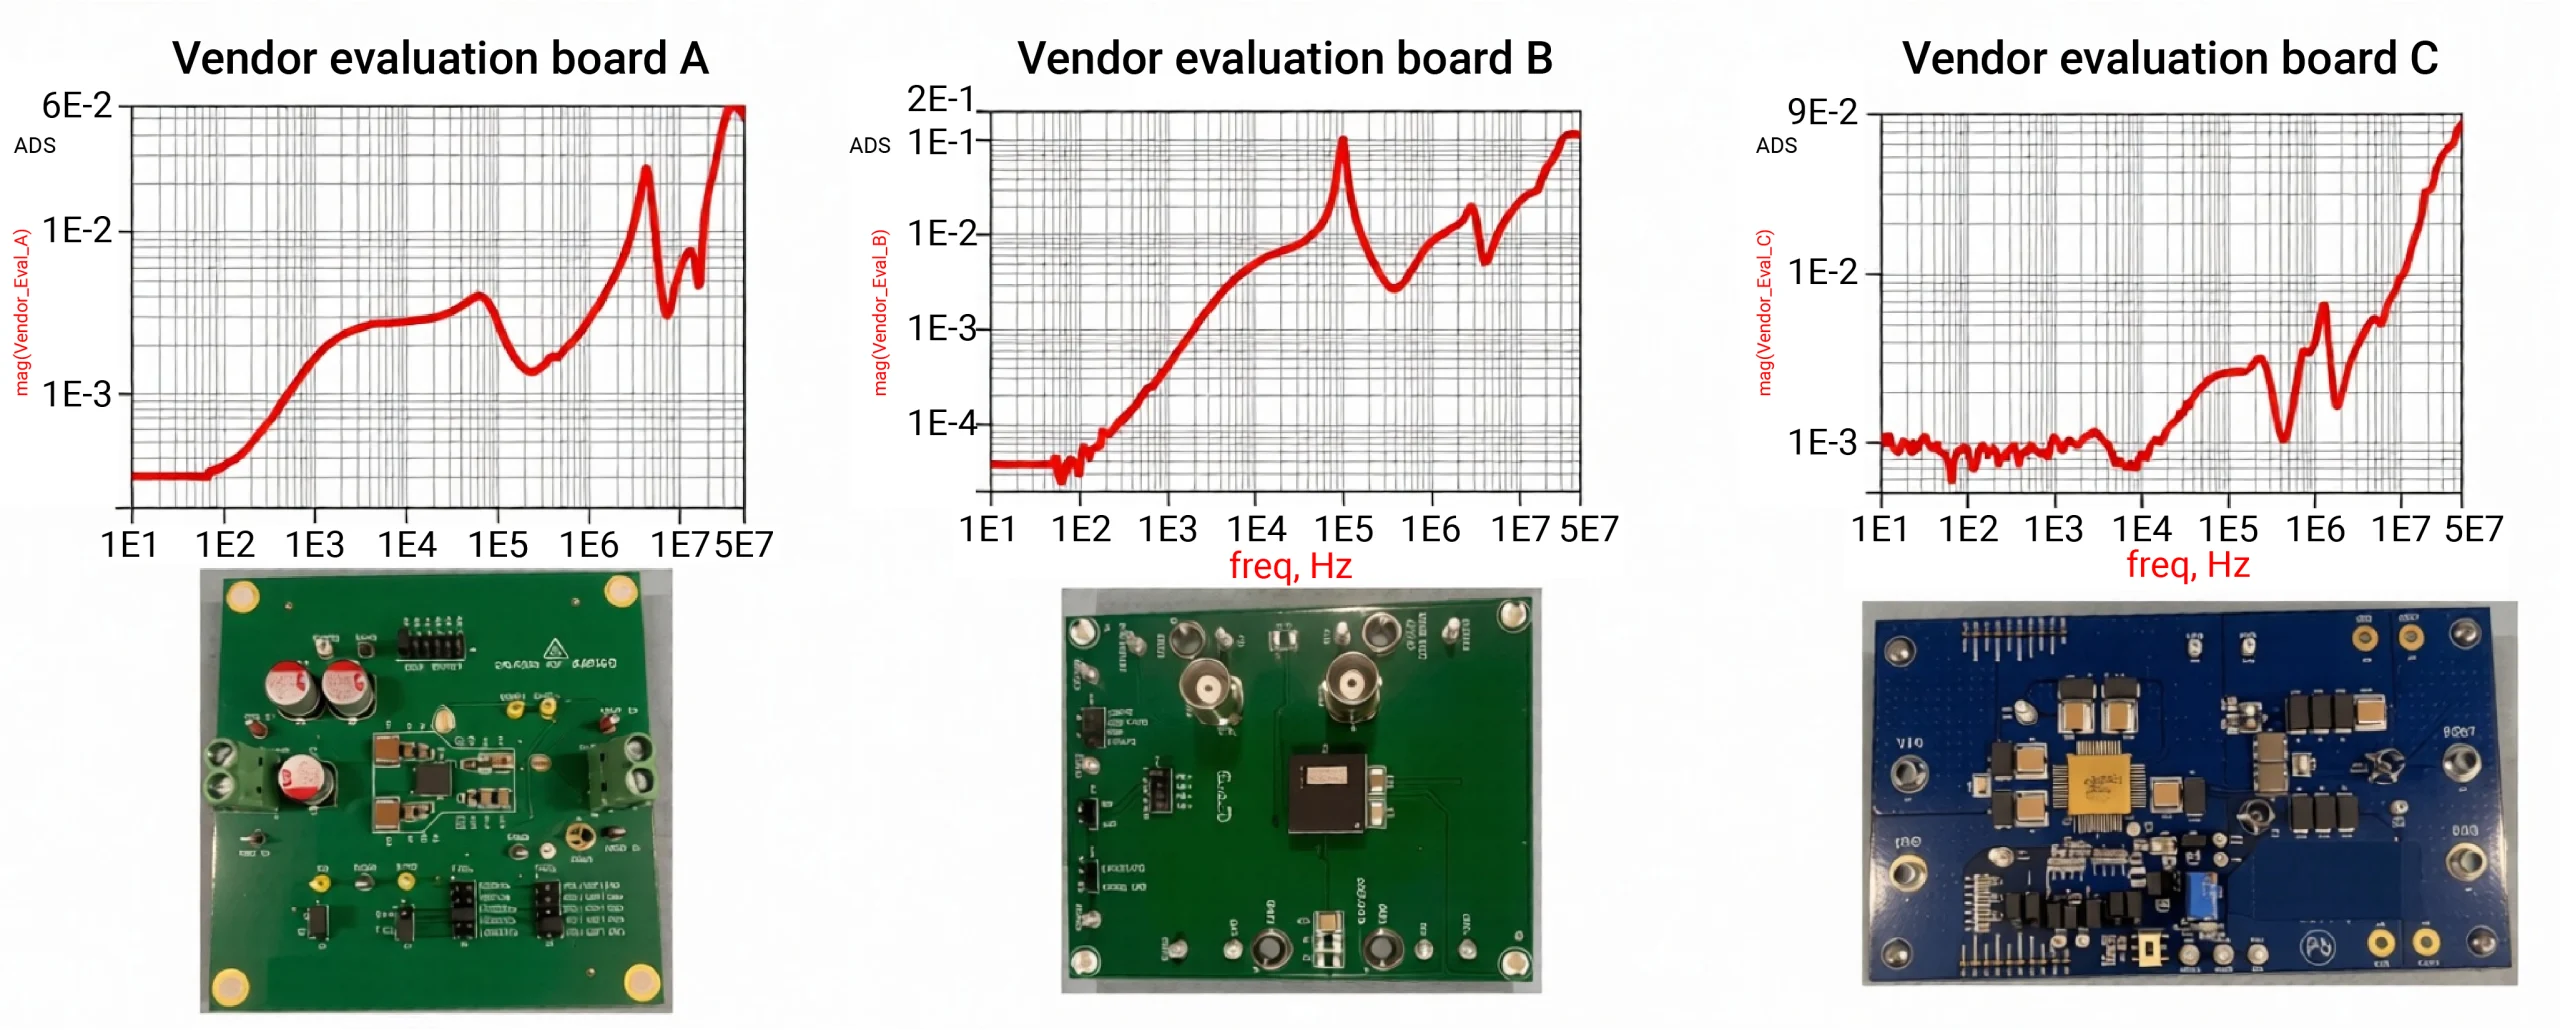
The measured metrics are summarized below.
| Eval board regulator | Resonance frequency | Q factor | Phase margin |
|---|---|---|---|
| ISL70002SEHD | 4.46 MHz | 3.21 | 17.7° |
| LTM4637 | 109 kHz | 7.15 | 7.9° |
| TPSM843B22 | 1.44 MHz | 3 | 19° |
These boards have Q factors greater than 2 and phase margins below 30°, indicating insufficient stability margins.
Need help designing a reliable PDN? Check out Sierra Circuits’ PCB Design Support. Our engineers can help you build low-impedance power networks and minimize voltage droop.

What is SEPIA?
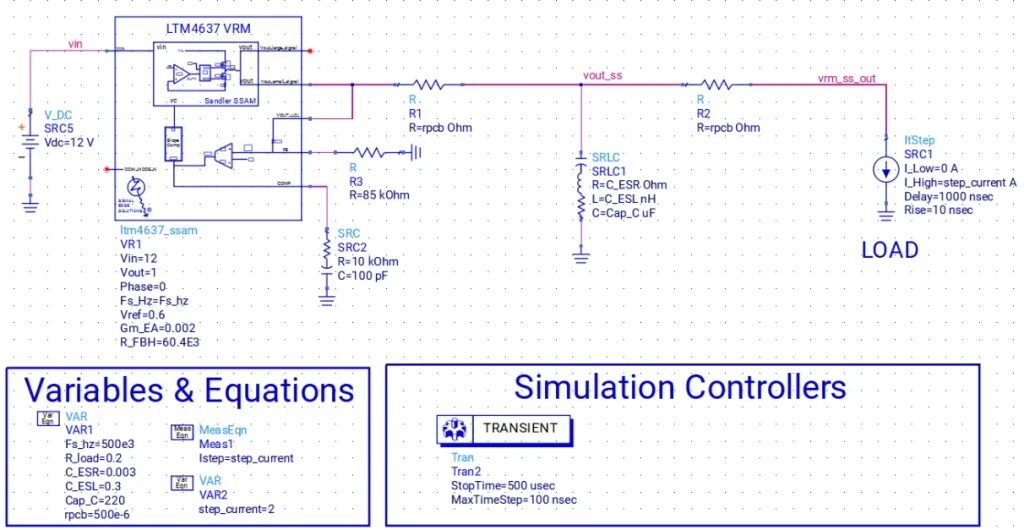
Scope-embedded power integrity analysis, developed by Steve Sandler, is a time-domain analysis technique that evaluates power supply stability and extracts an equivalent electrical SPICE model from a simple voltage step-response measurement.
It determines the loaded Q factor, phase margin, capacitance, excess inductance, natural and forced resonance frequencies, and output impedance.
If the design is unstable, SEPIA can recommend appropriate capacitor solutions for achieving a target impedance or suggest the minimum design adjustments required to obtain a stable solution.
SEPIA works for both LTI and non-LTI systems, making it a practical tool for power integrity design, analysis, simulation, and measurement.
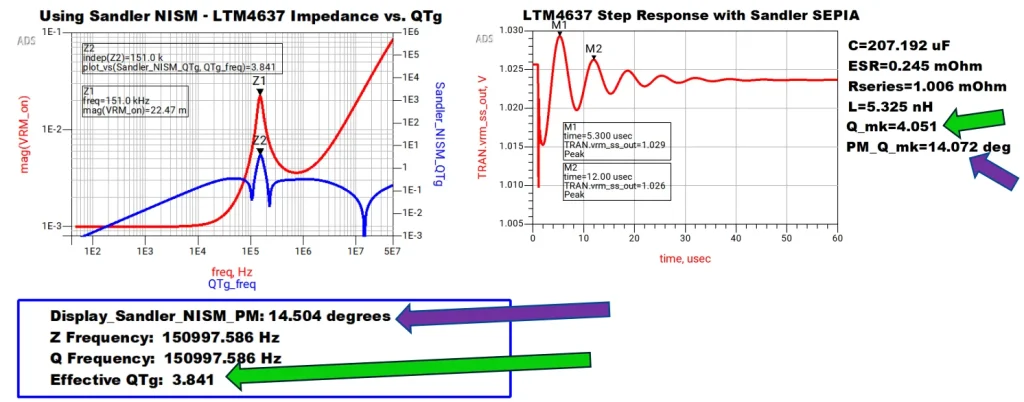
NISM uses impedance measurements in the frequency domain, and SEPIA derives the same information from a time-domain step response; both methods produce identical results.
| Stability parameter | NISM | SEPIA |
|---|---|---|
| Q factor | 3.841 | 4.051 |
| Phase margin | 14.5° | 14.5° |
During the live webinar, a designer questioned, “How exactly does SEPIA generate a SPICE model from a simple time-domain step-load measurement?”
Ben explained, “When we run the step response, we use Laplace transforms to calculate multiple gain transfer functions. Those functions are then used to generate the SPICE model directly from the time-domain response.”
What can SEPIA measure?
A step response from a VRM-PDN circuit reveals key electrical parameters, including capacitance, inductance, output impedance, Q factor, and phase margin, that characterize the system’s stability and performance.
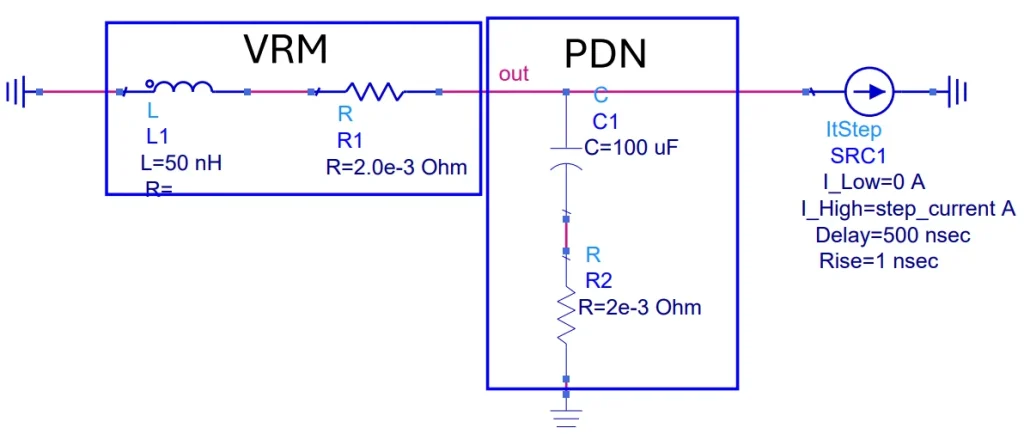
From the above step response, engineers can determine:
- Capacitance (C): 100 µF
- Inductance (L): 49.9 nH
- Series resistance (Rs): 2 mΩ
- Capacitor equivalent series resistance (ESR): 2 mΩ
- Q factor: 5.568
- Phase margin (@2 A): 10.263°
- Output impedance (Zo): 22.361 mΩ
- Natural and forced resonant frequencies
As the discussion shifted to different stability measurement techniques, one of the designers asked, “Since SEPIA operates in the time domain and tools like NISM operate in the frequency domain, do the stability metrics actually align?”
Ben Dannan explained, “Yes, they do. In fact, we’ve demonstrated this in both measurements and simulations, where the Q factor and phase margin align very closely between the two methods.”
Sierra Circuits offers high-quality rigid circuit boards for a wide range of applications with advanced technology, fast turnaround times, and precision manufacturing. Visit our rigid PCB capabilities to learn more.
How does SEPIA generate an equivalent SPICE model?
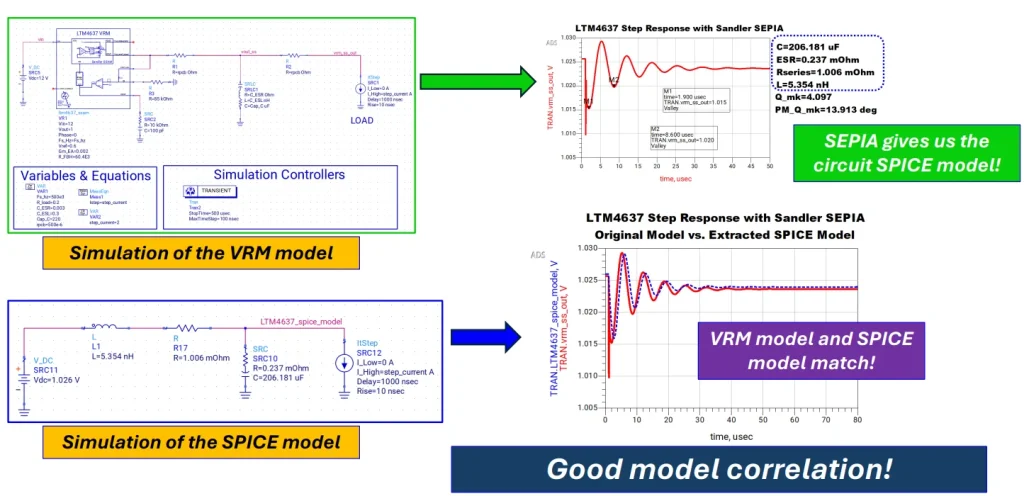
The LTM4637 model above demonstrates how SEPIA extracts the circuit’s electrical parameters from a single voltage step-response measurement and reconstructs an equivalent SPICE model.
The generated SPICE model is then simulated using the same step-response conditions as the original regulator model. The close agreement between the two transient responses shows that the reconstructed model accurately represents the original circuit, enabling engineers to characterize a power supply’s output impedance without requiring access to its internal implementation.
While on the subject, we received another question, “What happens if the VRM output is critically damped or overdamped and there are no visible ‘rings’ or peaks in the step-load response? Can SEPIA still calculate the phase margin?”
Ben Dannan explained, “Yes. The math in SEPIA changes automatically. It checks for both critically damped and overdamped responses and calculates the phase margin accordingly. The mathematical approach is different for underdamped and overdamped systems, but the software can accurately calculate the phase margin for both.”
To learn how to build boards with uniform impedance, download the Controlled Impedance Design Guide.
Controlled Impedance Design Guide
6 Chapters - 56 Pages - 60 Minute ReadWhat's Inside:
- Understanding why controlled impedance is necessary
- Stack-up design guidelines
- How to design for impedance
- Common mistakes to avoid
Download Now
How to automate VRM stability validation using StepLoad ProTM?
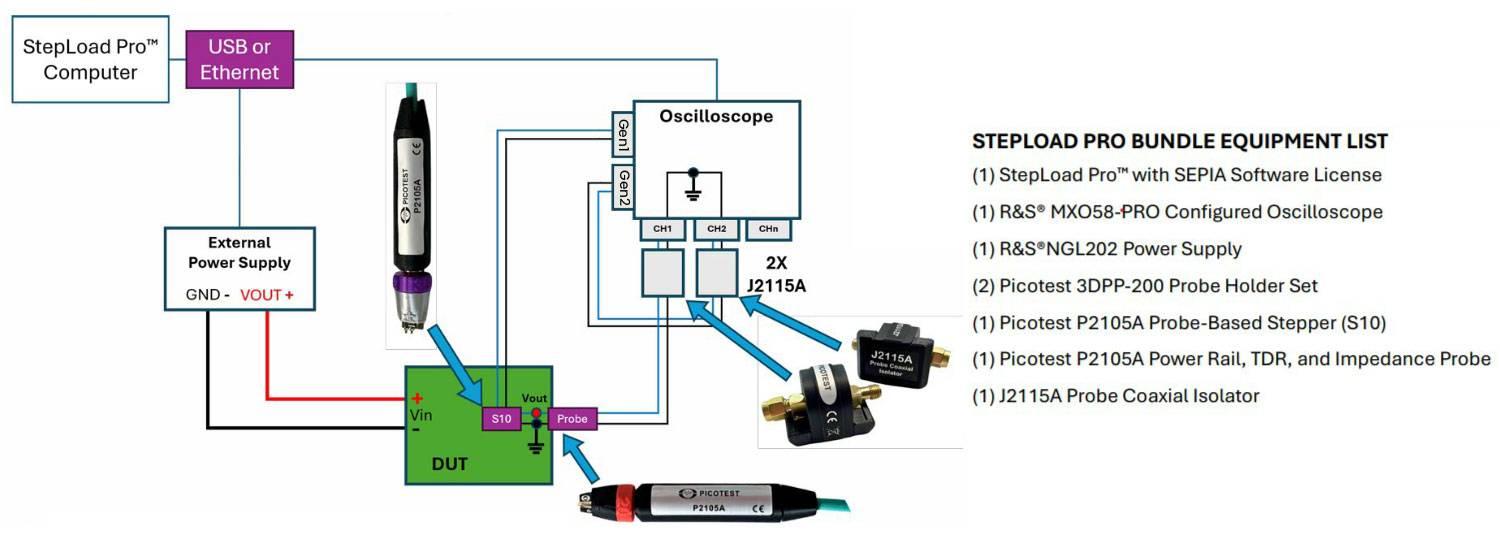
Step 1: Configure the test setup
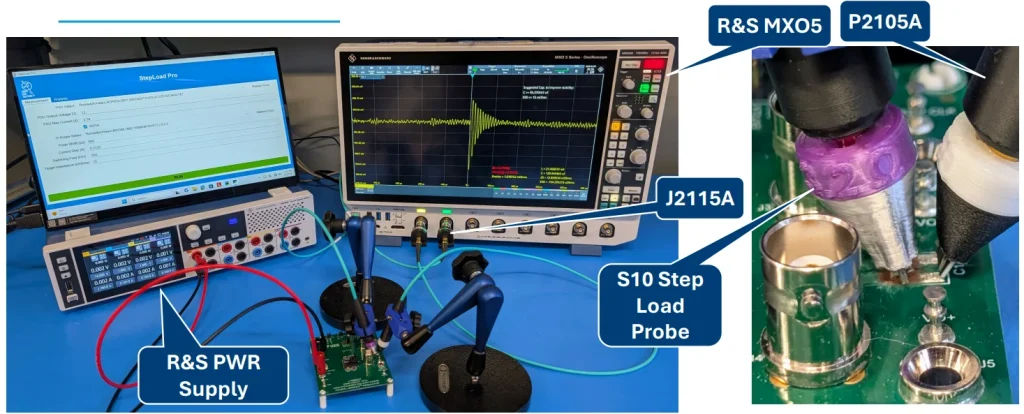
The setup includes a PC running StepLoad Pro, an oscilloscope, an external 12V power supply, a StepLoad probe, and a voltage measurement probe connected to a VRM evaluation board.
Before starting the measurement, configure:
- Input voltage
- Current limit (if required)
- Step-response pulse width
- Current step
Step 2: Perform the automated test
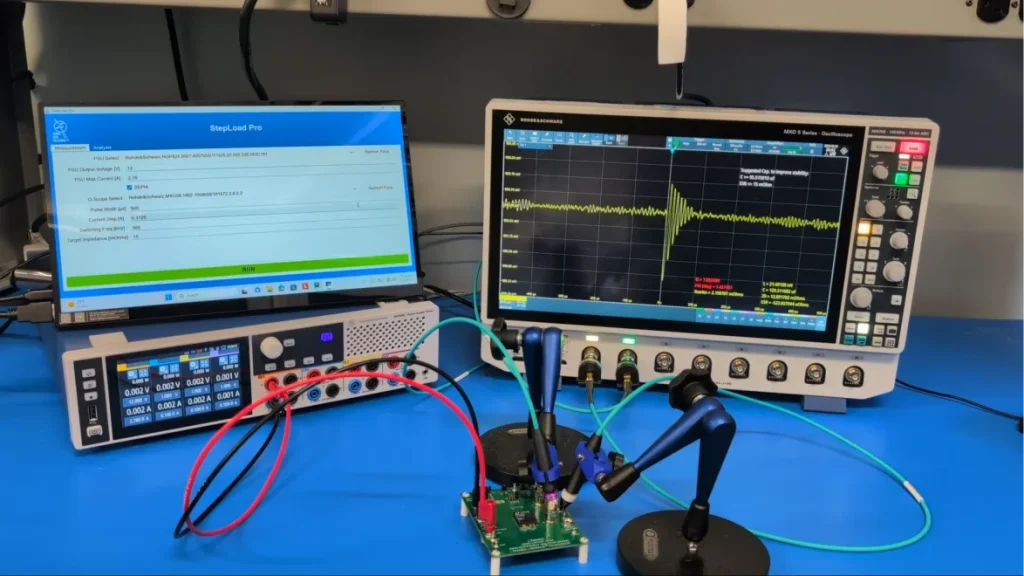
Click run to start the test. The system:
- Powers the DUT
- Generates the step-response stimulus
- Configures the oscilloscope trigger and probe termination
- Captures and rescales the transient waveform
- Performs the stability calculations
The entire process is completed without manual oscilloscope adjustments.
Step 3: Review the VRM stability results
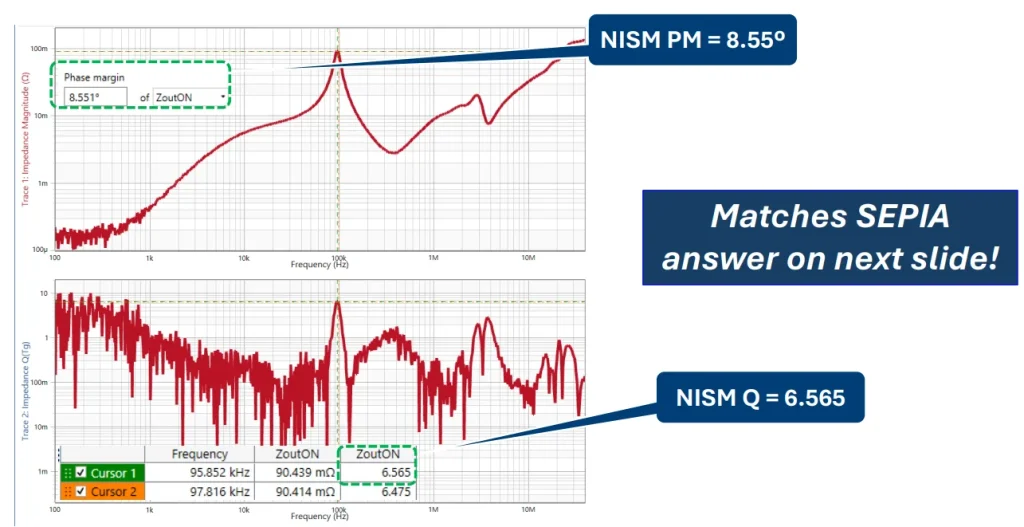
Within approximately 20 seconds, the software reports the:
- Q factor
- Phase margin
- Equivalent SPICE model
- Stability status
If the design is unstable, StepLoad Pro also recommends the design changes required to improve efficiency.
During this demonstration, another engineer asked, “Can SEPIA calculate other regulator output impedances other than the simple R-L model?”
Ben answered, “SEPIA generates a passive RLC model of the VRM output impedance. If you’re looking for a full active model, you’d typically use a state-space averaged model instead. That’s not what SEPIA is designed to provide. It generates an equivalent passive model.”
Step 4: Apply the recommended PDN fix
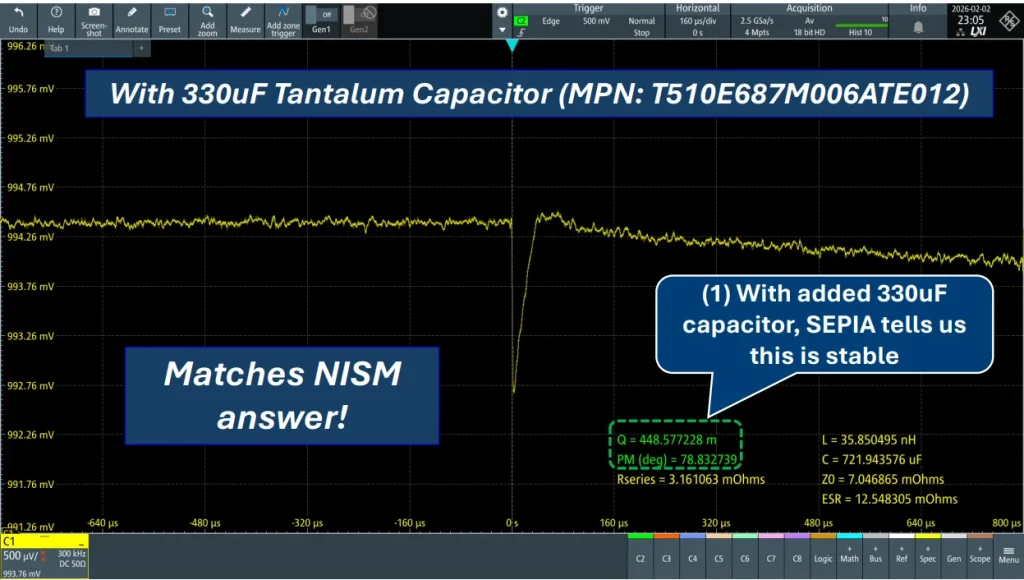
StepLoad Pro recommends the minimum design changes required to improve VRM stability in PCBs. In this example, adding a 330 µF capacitor to the PDN and repeating the step-response measurement reduces the Q factor to 0.448 and increases the phase margin to more than 78°, indicating stable operation.
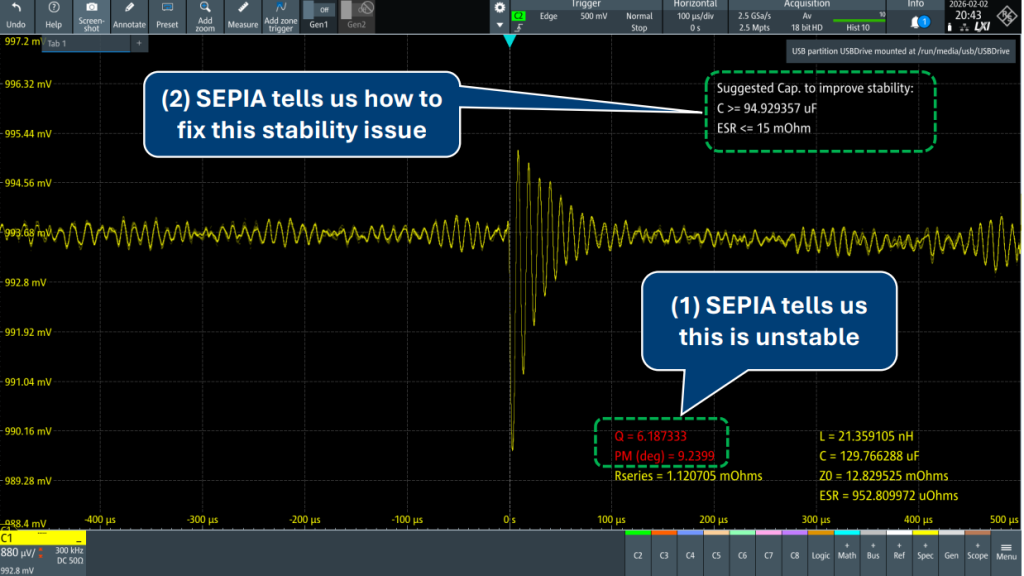
We received a query from an engineer saying, “I think you mentioned that both SEPIA and NISM are consistent with the Nyquist criteria?”
Ben explained, “Yes, that’s correct. Both methods evaluate the stability margin, making them consistent with the Nyquist criteria.”
Key points to remember:
- SEPIA can analyze LTI and non-LTI systems, making it suitable for evaluating modern regulator modules where conventional Bode plots may be insufficient.
- Design the PDN for a flat impedance profile whenever possible. If a flat response cannot be achieved, aim for a Q factor below 2 to maintain an adequate VRM stability in your PCBs.
- Scope embedded power integrity analysis extracts key metrics, including Q factor, phase margin, output impedance, capacitance, inductance, and resonance frequencies from a single step-response measurement.
- Effective PDN validation requires end-to-end analysis, covering the entire power path from the power supply to the load using both small-signal and large-signal measurements.
- StepLoad Pro with SEPIA automates the complete workflow, enabling engineers to evaluate designs and incorporate improvements in under a minute.
As voltage regulator module designs become increasingly complex, VRM stability tests in PCBs must reflect real operating conditions. Combining proven measurement techniques with automated analysis helps engineers move beyond assumptions and validate power supply performance with greater confidence.

About the presenter:
Ben Dannan is the founder of Signal Edge Solutions and a Principal Engineer with over 20 years of experience in signal and power integrity. He specializes in high-speed interface design, power delivery networks, and system-level simulation.




Start the discussion at sierraconnect.protoexpress.com