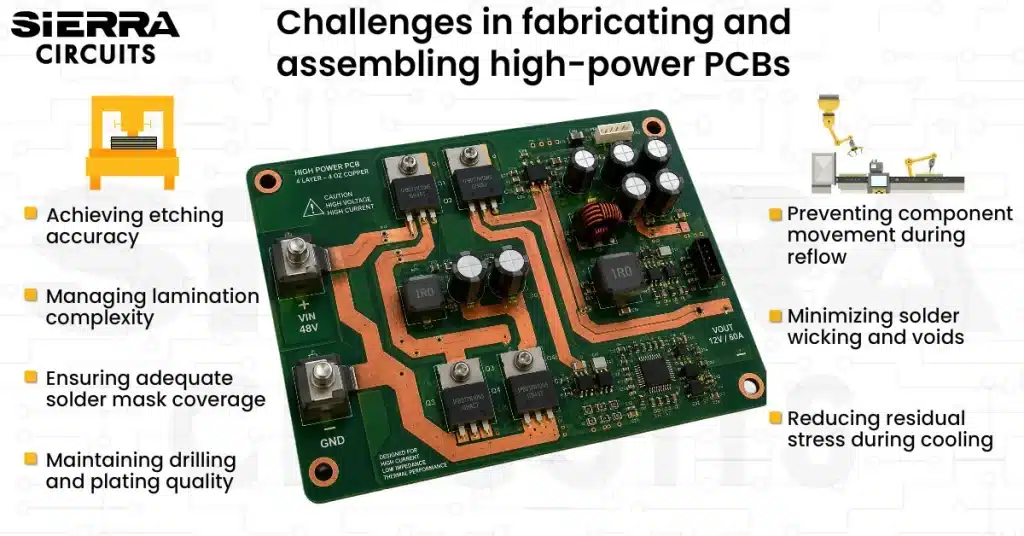
Contents

On-demand webinar
How Good is My Shield? An Introduction to Transfer Impedance and Shielding Effectiveness
by Karen Burnham
Transient analysis is one of the critical aspects to ensure signal integrity in your PCB design. The main goal is to figure out how a circuit reacts to the variations of driving voltage/current.
Non-sinusoidal sources are used prominently in the world of electronics today. Transient analysis of circuits with such sources is an important prerequisite for designing an efficient high-speed circuit board.
In this article, we will go through the steps to perform transient analysis by a conventional method and using simulation tools.
What is transient analysis?
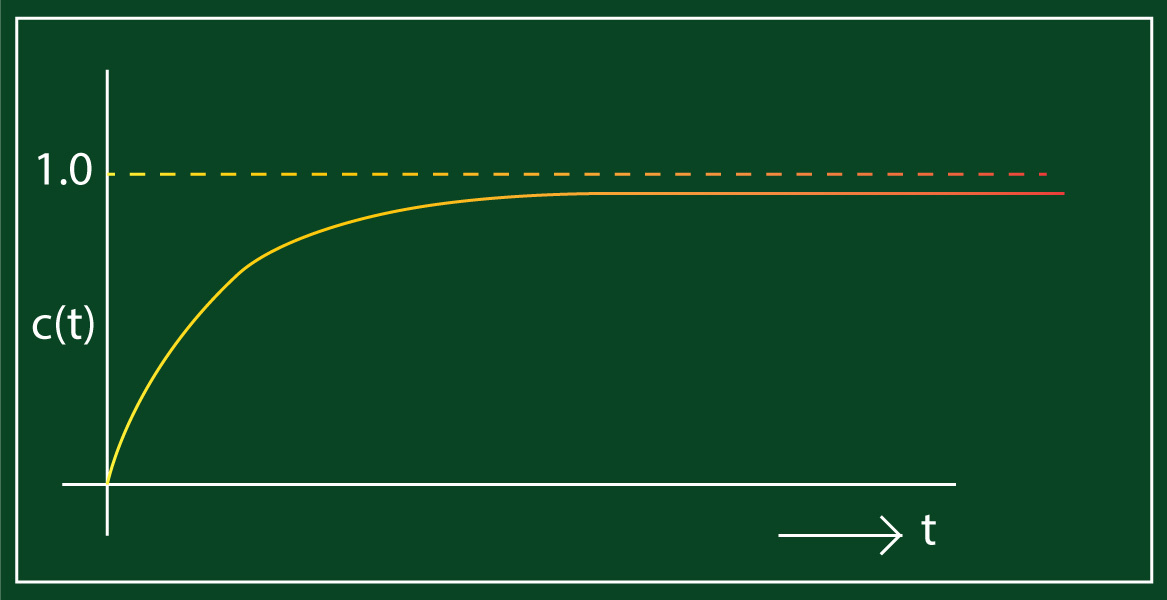
Electronic circuits are driven by their voltage/current sources. Once the voltage source is connected to a circuit, it takes a certain amount of time to attain a steady state.
In other words, the voltage and current take some time to reach the desired value. This transition time or transient time is in the range of microseconds to a few milliseconds. The study of current and voltage behavior during this transition time is referred to as transient analysis.

Signal Integrity eBook
6 Chapters - 53 Pages - 60 Minute ReadWhat's Inside:
- Impedance discontinuities
- Crosstalk
- Reflections, ringing, overshoot and undershoot
- Via stubs
Download Now
Why do we perform the transient analysis?
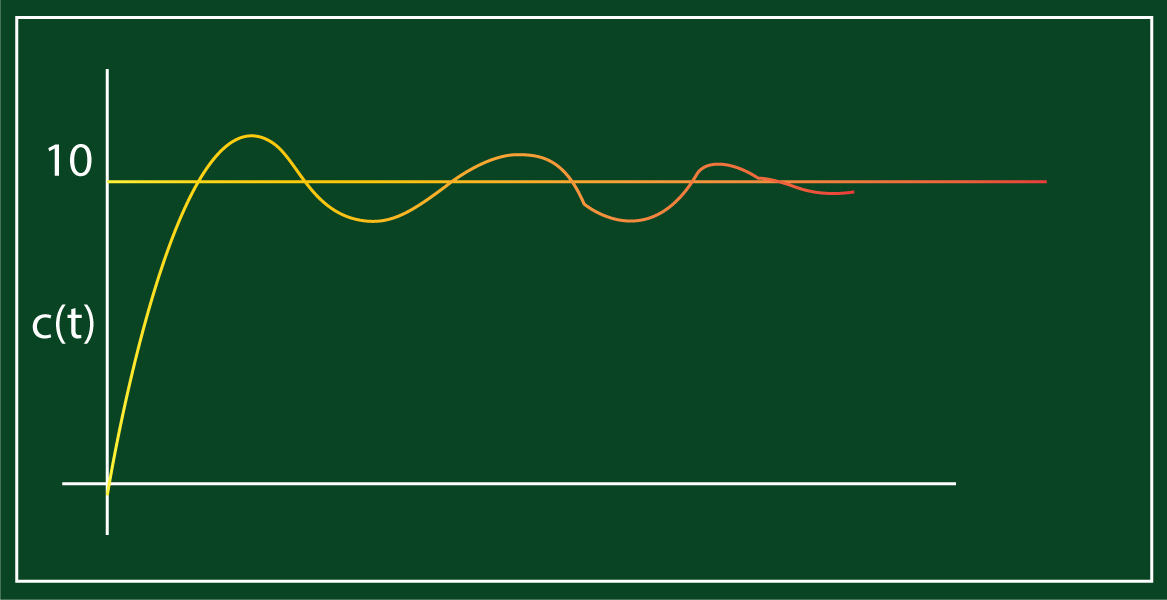
Transients in any electronic system describe the circuit’s behavior during the transition between two steady states. Performing transient analysis plays an important role to understand ringing in a transmission line. This behavioral analysis can help in predicting whether your board will work as expected.
Ringing is a voltage or current output that oscillates. The oscillation is a response to a sudden change in the input signal, like turning it on or switching it off. The oscillation frequently pushes the output signal frequency out of the tolerance range.
This ripple gradually smoothens after a certain amount of time. The time taken by the output wave to fall within the acceptable range is called settling time. To know the level of ringing in your design, try Sierra Circuits’ Transmission Line Reflection Calculator.
Transmission Line Reflection Calculator
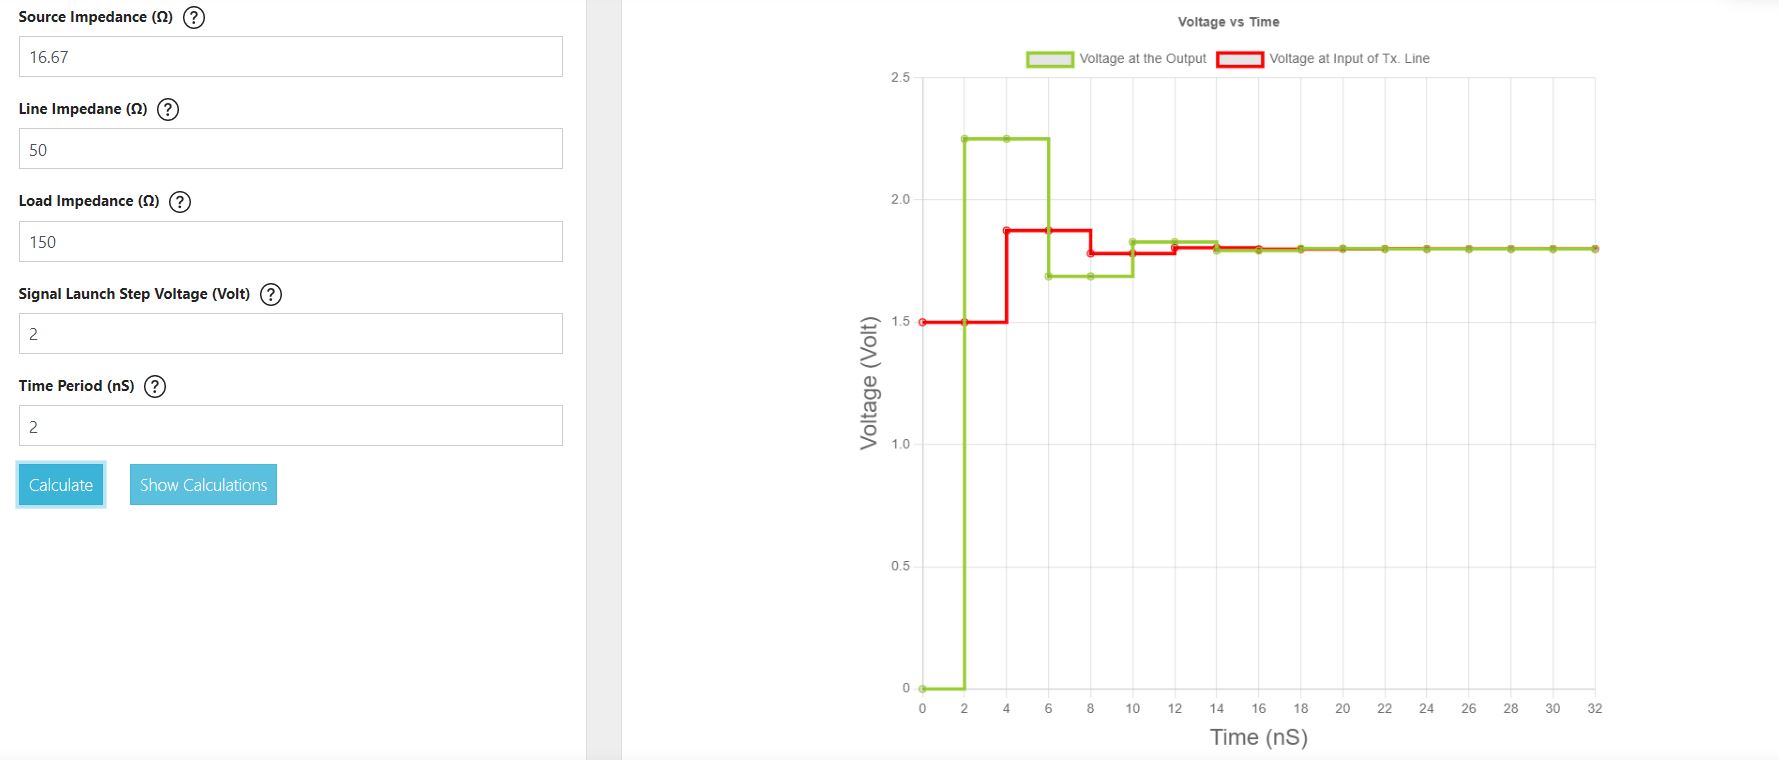
The Transmission Line Reflection Calculator graphically displays the ringing of a signal in the interconnect caused due to multiple reflections.
Using this tool, you can see the signal reflections at the input and the load during the design phase. You will have to provide the source, line, and load impedance values to view the graph that depicts ringing.

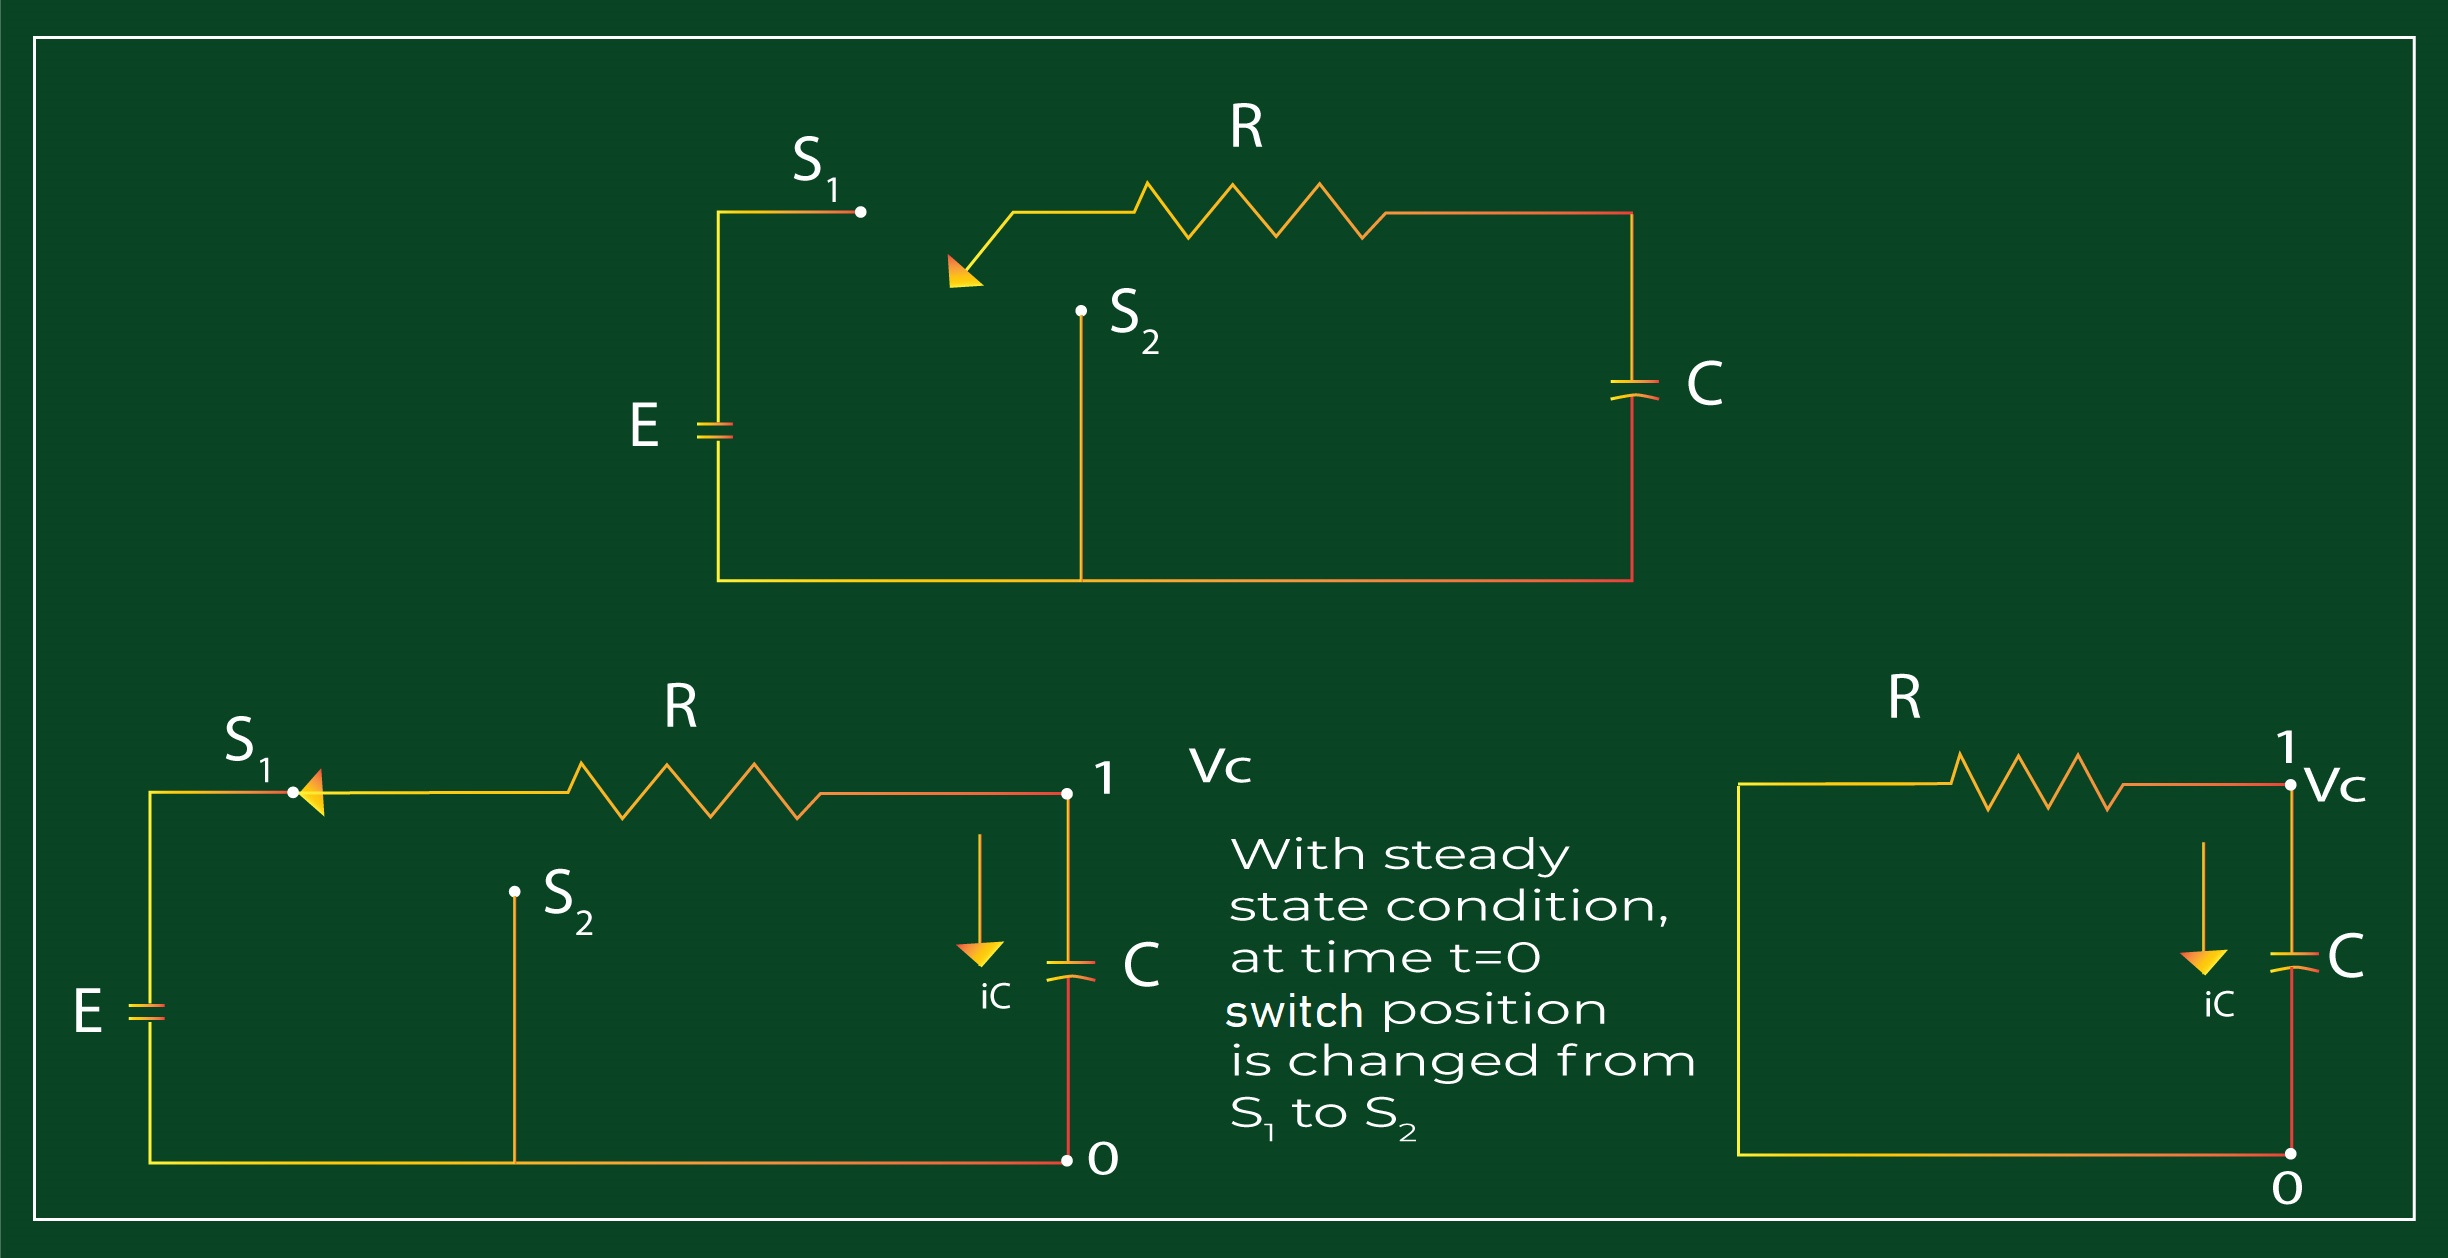
Analyzing the behavior of transients in RLC circuit
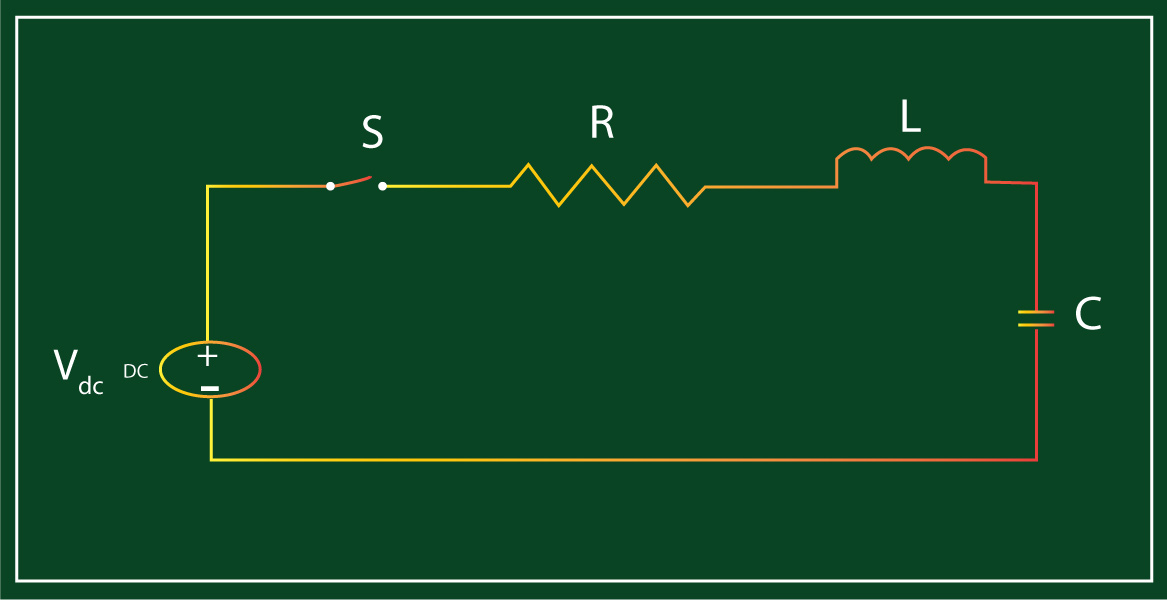
In this section, we will have a look at the transient response of a series RLC circuit using a conventional method.
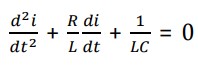
The above circuit has a series connection among resistance, inductance, and capacitance across a constant DC source.
Applying Kirchoff’s voltage law to the above circuit, we arrive at the following differential equation.
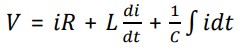
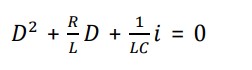
Differentiating the above equation, we get
The characteristic equation of the above is
The roots of the above differential equation are D1 = K1 + K2 and D2= K1 – K2;
The value of K2 can be positive, negative, or zero.
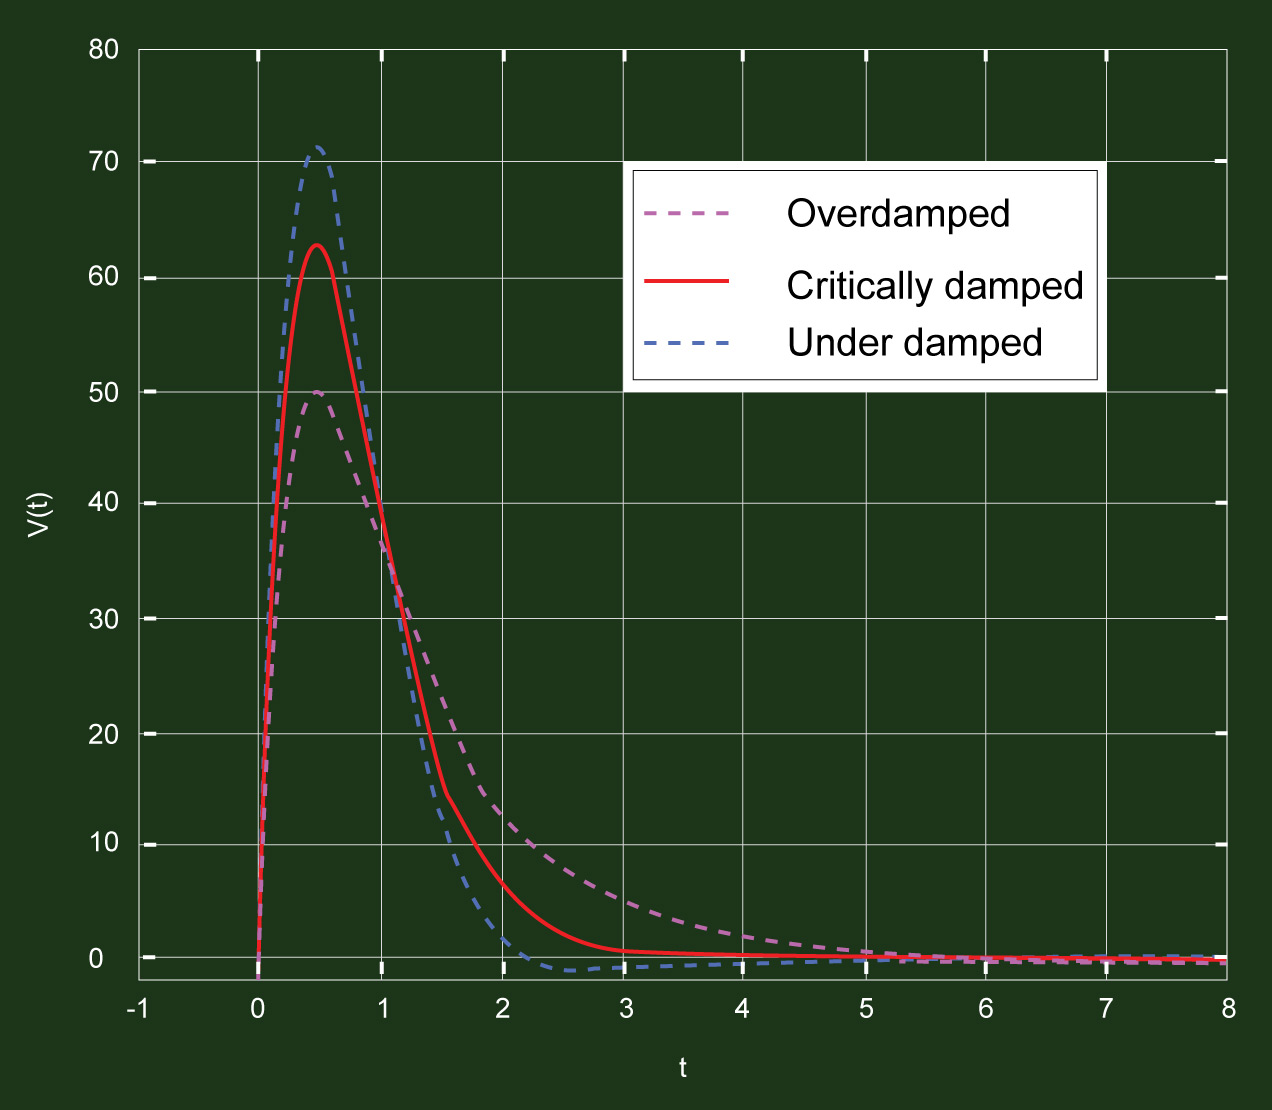
Case 1: K2 is positive; 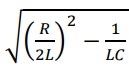
In this case, the roots are real and unequal. This results in an overdamped response.
Case 2: K2 is negative and provides the underdamped response
Case 3: K2 is 0; which results in a critically damped response
The oscillations in the critically damped response are very less when compared to the other two responses. You will have to aim to achieve a critically damped response to make your design efficient.
The time-domain graphs for underdamped, critically damped, and overdamped are shown below.
Transient analysis for a non-sinusoidal wave using SPICE simulation
As seen in the previous section, transient analysis using the conventional method involves solving complex differential equations. This can sometimes be time-consuming.
To speed up the design process, you can use simulation tools such as the SPICE ( Simulation Program with Integrated Circuit Emphasis) simulator.
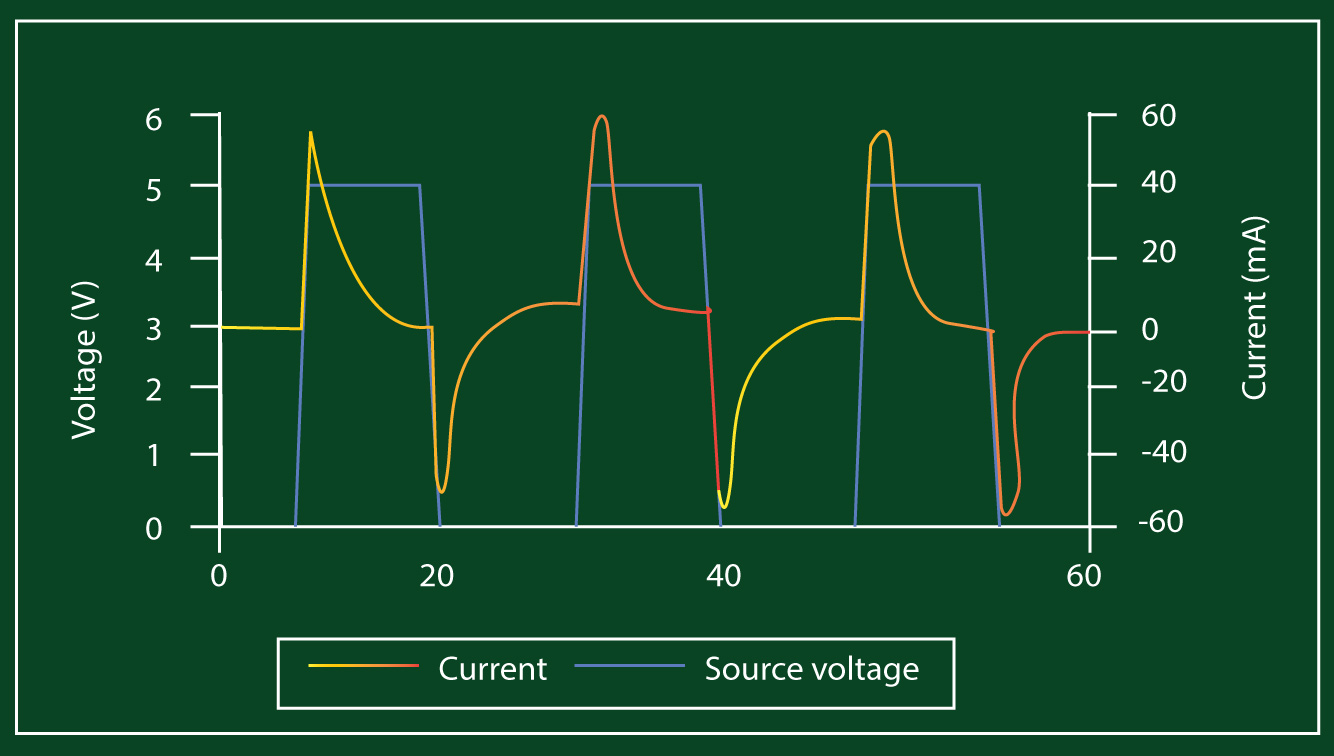
The transient response of a series RC circuit operated by a sequence of digital pulses is shown in the graph. This circuit uses a 5 V square wave to power a 100 Ohm resistor in series with a 20 pF capacitor.
The current in the circuit (orange curve) indicates a transient response with a 2 ns time constant as the driver cycles between ON and OFF states.
The phase and amplitude of the current in any circuit driven by a harmonic AC voltage/current source with a certain frequency can be investigated using transient analysis.
When using a SPICE simulator, you can place probes at certain spots in the circuit to determine the current. Voltage drop measurements across specific circuit components can also be obtained, resulting in a time-domain graph similar to the one shown above.

Transient analysis using poles and zeros
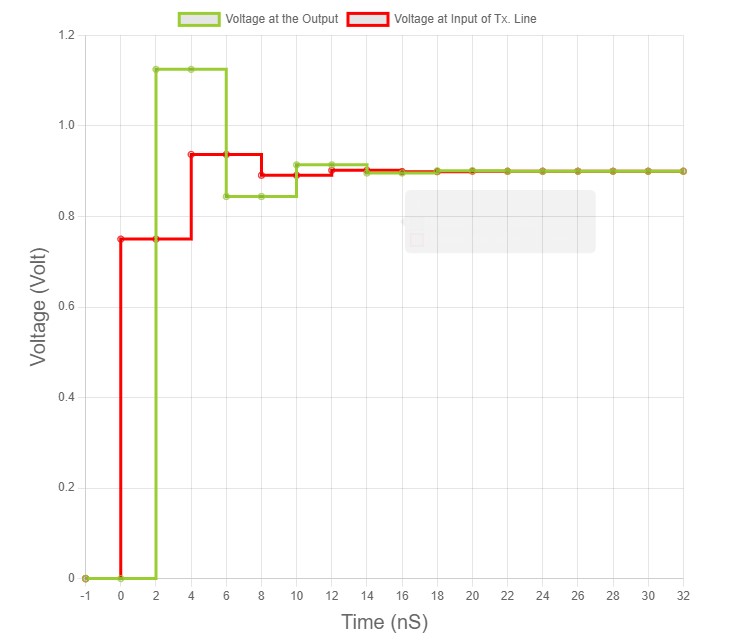
When it comes to high-speed PCB design, controlled impedance is one of the important factors to be considered. This is because the high-speed signal generally undergoes reflections due to its fast switching characteristics. This can be observed in the graph above.
This transient response (reflections) of a signal will cause signal integrity issues in your design. Impedance matching is one of the solutions to avoid such reflections.
However, the effect of ringing can still occur at the receiver end due to the presence of transients. Hence, it becomes vital to perform a transient analysis for the high-speed designs.
Poles and zeroes analysis is one of the quickest ways to understand the transient behavior of your design. This analysis enables you to understand whether your design is overdamped or underdamped and make necessary edits to achieve a critically damped response.
In order to understand poles and zeroes, you will have to be familiar with the Laplace transform and transfer function. This analysis is all about calculating the damping constant and oscillation frequency of your circuit board.
The number of poles and zeroes increases as the complexity of the board increases. For instance, the first or second-order derivative of charge may have two possible poles.
The number of poles and zeroes can go up for complex higher-order circuits such as Aerospace and Defense PCBs.
Calculating these numbers manually would be a challenging task as it requires solving higher-order polynomials. You can fasten this process by using pole-zero analysis.
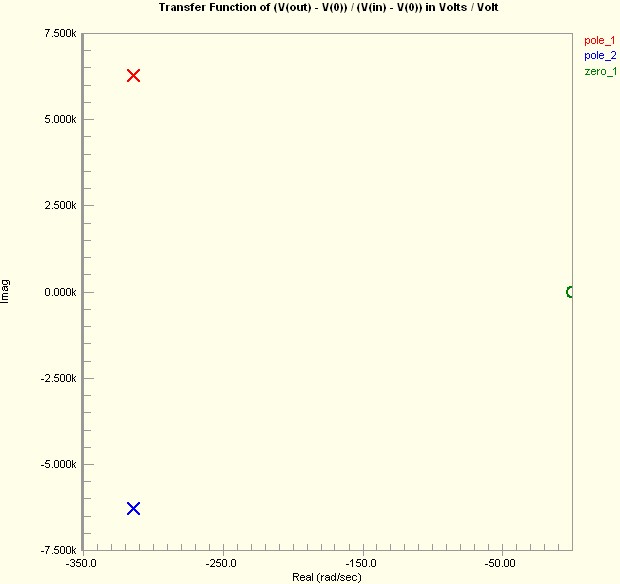
The graph above shows an example output from the pole-zero analysis. We can observe that it has two poles and one zero.
The placement of the poles signifies two things:
- The real part of the pole is the damping constant (-315 rad/sec)
- The imaginary component represents oscillation frequency (1 kHz)
The zeroes refer to specific frequencies in the circuit that produce a zero output. Since the zero is at the origin in this example, the DC driver will not pass current through the circuit.
If the zero was situated somewhere else on the imaginary axis, the value on the axis would correspond to a frequency that would not produce a current in the circuit.
If you discover that your circuit has an undesirable response (for example, an underdamped response in an impedance-matching network), you can iterate over various component values in your circuit to find the component values that create the desired response.
Transient analysis is an essential step in circuit board design as it helps you to understand the behavior of your design between two steady states.
Although achieving critical damping is practically not possible, the study of transients will help you understand the required changes that need to be incorporated into your system to get closer to a critical damping response.
If you would like to learn anything specific to circuit board design and manufacturing, let us know in the comments section. If you are a designer who deals with high-speed signals, then you might find our high-speed design guide quite useful.

About Milan Yogendrappa : Milan Y is an electronics and communication engineer with over 6 years of experience in developing and editing technical articles related to PCB design, manufacturing, and assembly. He is currently the editor-in-chief at Sierra Circuits.