
Speak to an Account Manager
 +1 (800) 763-7503
Tools for Designers:
Transmission Line Reflection Simulator
Sierra Circuits' Transmission Line Reflection Simulator is a signal integrity tool that utilizes a SPICE-based engine to model the dynamic behavior of high-speed signals as they propagate through PCB traces, cables, and interconnects.
Try This New ToolThe Transmission Line Reflection Simulator visualizes signal integrity issues such as overshoot, ringing, propagation delay, and signal attenuation based on trace length, characteristic impedance, parasitic inductance, and parasitic capacitance.
This predictive capability enables you to identify and resolve signal integrity issues early in the design phase, before prototyping.
The tool allows you to simulate and analyze:
- Signal reflection behavior due to impedance mismatches
- Lossless vs. lossy transmission line performance
- Impact of driver and receiver parasitics on signal quality
- Timing margins and signal degradation across interconnects
- Eye diagrams for evaluating signal integrity with PRBS inputs
Key features of the Transmission Line Reflection Simulator
- Visualizes signal reflections caused by impedance mismatches along the transmission path.
- Supports multiple transmission line models such as ideal, lossless (LC), and lossy (RLGC) transmission line models.
- Accounts for inductance and capacitance at the source and load ends.
- Supports step, clock (periodic), sine, and PRBS inputs for different signal integrity analyses.
- Calculates rise and fall time, ringing frequency, and propagation delay at the receiver.
- Enables precise control of driver impedance, termination resistance, and load characteristics.
- Displays multiple signal waveforms (voltage vs. time and eye diagrams) to analyze signal behavior across the transmission path.
How to use the Transmission Line Reflection Simulator
The tool supports the following conductor models:
- Ideal transmission line
- Lossless transmission line (LC)
- Lossy transmission line (RLGC)
Based on the transmission line model you choose, the required input parameters dynamically change. You can skip the instructions for the models that you don’t select.

Transmission line model 1: Ideal transmission line
It is a purely mathematical model that requires only line impedance (Z0) and propagation delay (TD).
Step 1: Enter Line Impedance (Z0) and Propagation Delay (TD).

Step 2: Select the source type under the Source Parameters drop-down: Step (Single Pulse), Clock (Periodic), Sine, or PRBS (Pseudo-Random Bit Sequence).
- If you choose Step (Single Pulse), enter Launch Voltage/Amplitude and Rise Time.

- If you select Clock (Periodic), enter Launch Voltage/Amplitude, Frequency, Duty Cycle, and Rise/Fall Time.

- If you select Sine, enter Frequency, Rise Time, and Offset.

- If you select PBRS, enter Data Rate, Bit Count, and Rise Time.

Step 3: Provide Source Resistance (Rs) and Load Resistance (Rl) under the Input/Output Parameters section and click Simulate.

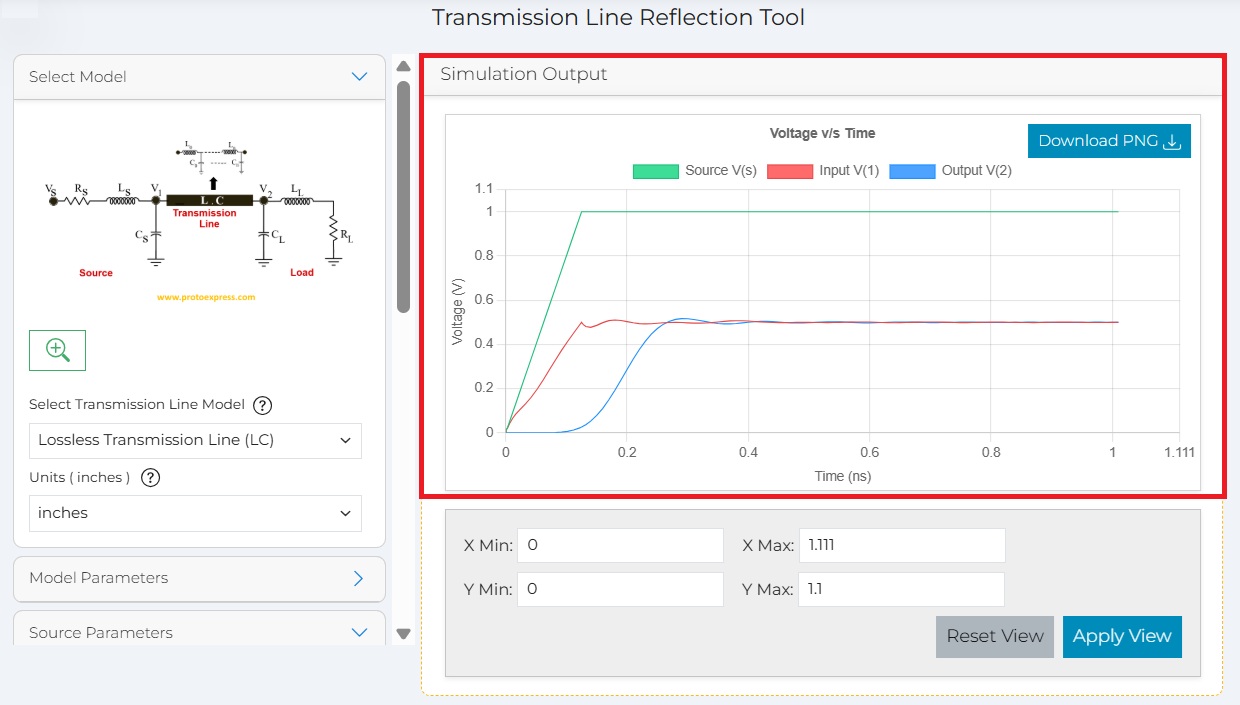
For Step, Clock (Periodic), and Sine source types, the tool displays the resulting output waveform.

For PRBS, the tool generates an eye diagram to evaluate signal integrity.

Use the Choose output plot dropdown to switch between the eye diagram and the time-domain waveform.

Transmission line model 2: Lossless Transmission Line (LC)
This structure models the trace as a physical chain of inductors and capacitors. It accurately captures signal ripple, dispersion, and the impact of track length.
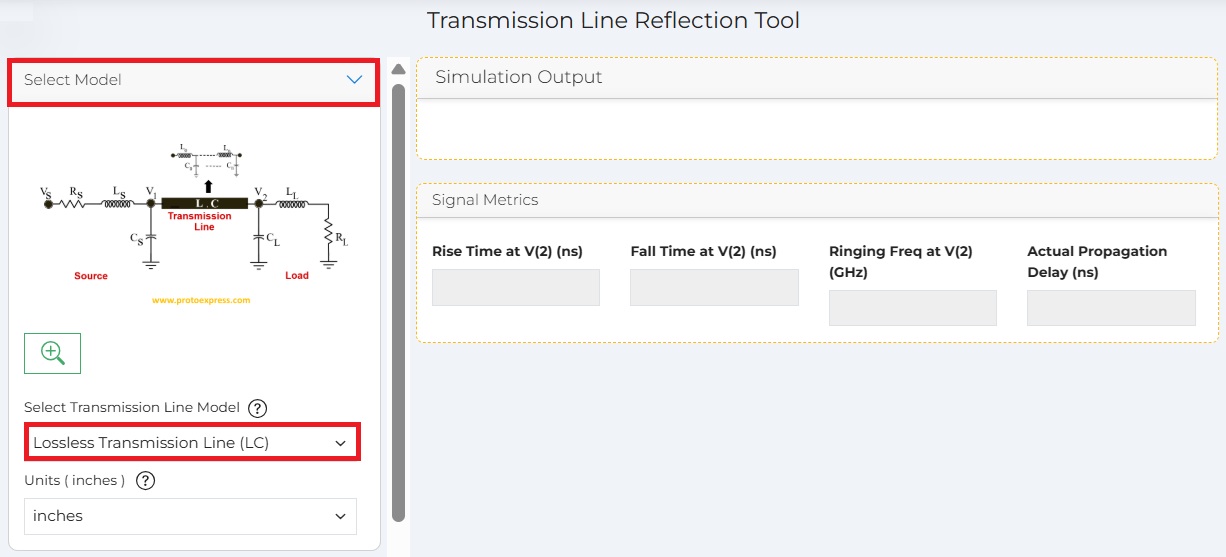
Step 1: Enter Inductance, Capacitance, and Total Length.

Step 2: Select the source type under the Source Parameters drop-down: Step (Single Pulse), Clock (Periodic), Sine, or PRBS (Pseudo-Random Bit Sequence).
- If you choose Step (Single Pulse), enter Launch Voltage/Amplitude and Rise Time.

- If you select Clock (Periodic), enter Launch Voltage/Amplitude, Frequency, Duty Cycle, and Rise/Fall Time.

- If you select Sine, enter Frequency, Rise Time, and Offset.

- If you select PBRS, enter Data Rate, Bit Count, and Rise Time.

Step 3: Provide Source Resistance (Rs), Source Inductance (Ls), Source Capacitance (Cs), Load Resistance (RI), Load Inductance (LI), and Load Capacitance (Cl), and click Simulate.
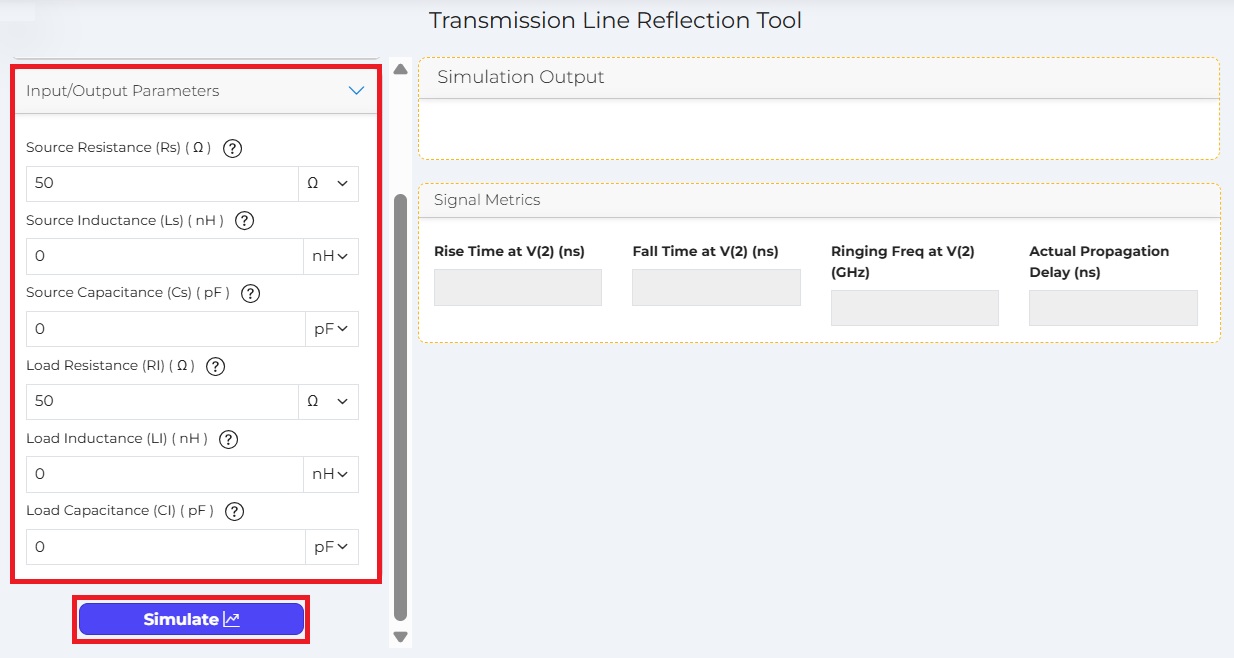
For Step, Clock (Periodic), and Sine source types, the tool displays the resulting output waveform.
For PRBS, the tool generates an eye diagram to evaluate signal integrity.
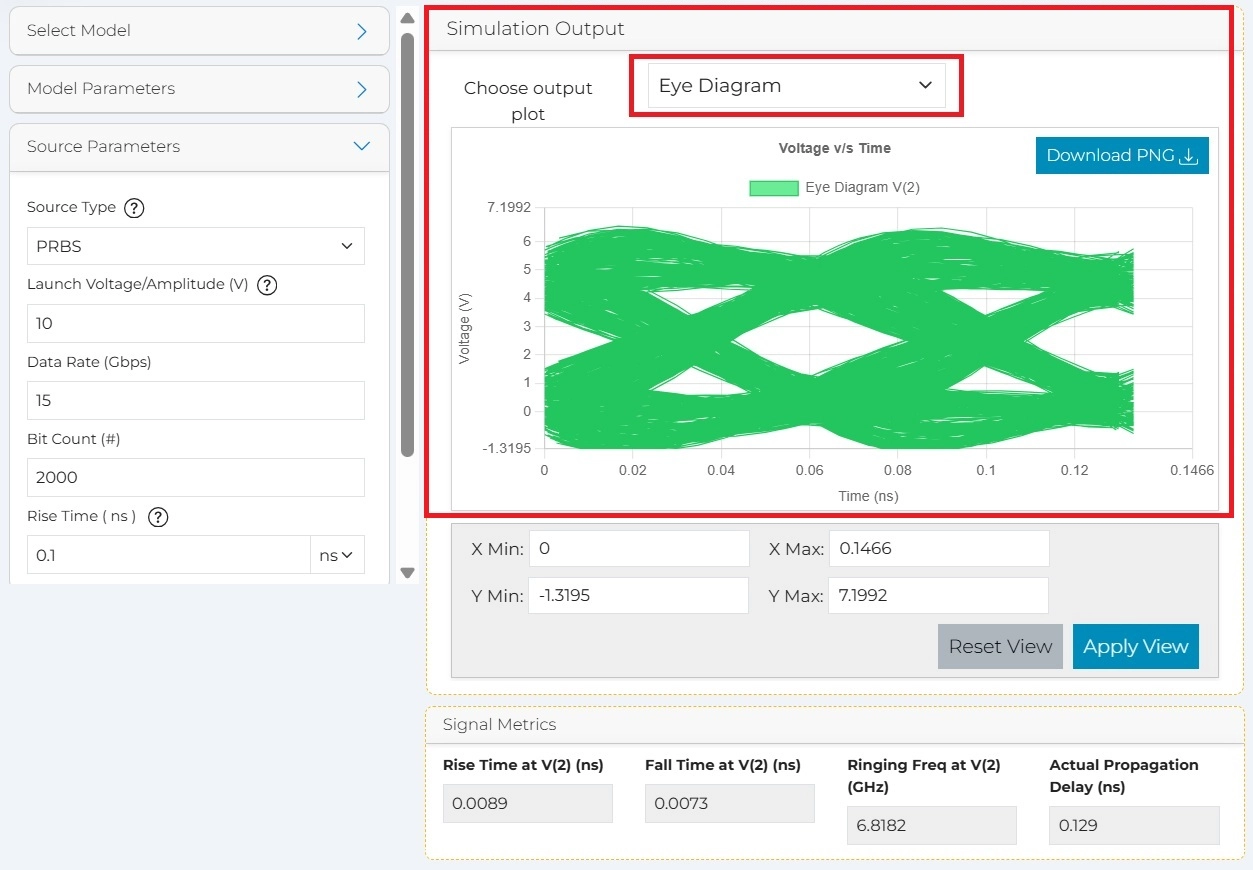
Use the Choose output plot dropdown to switch between the eye diagram and the time-domain waveform.
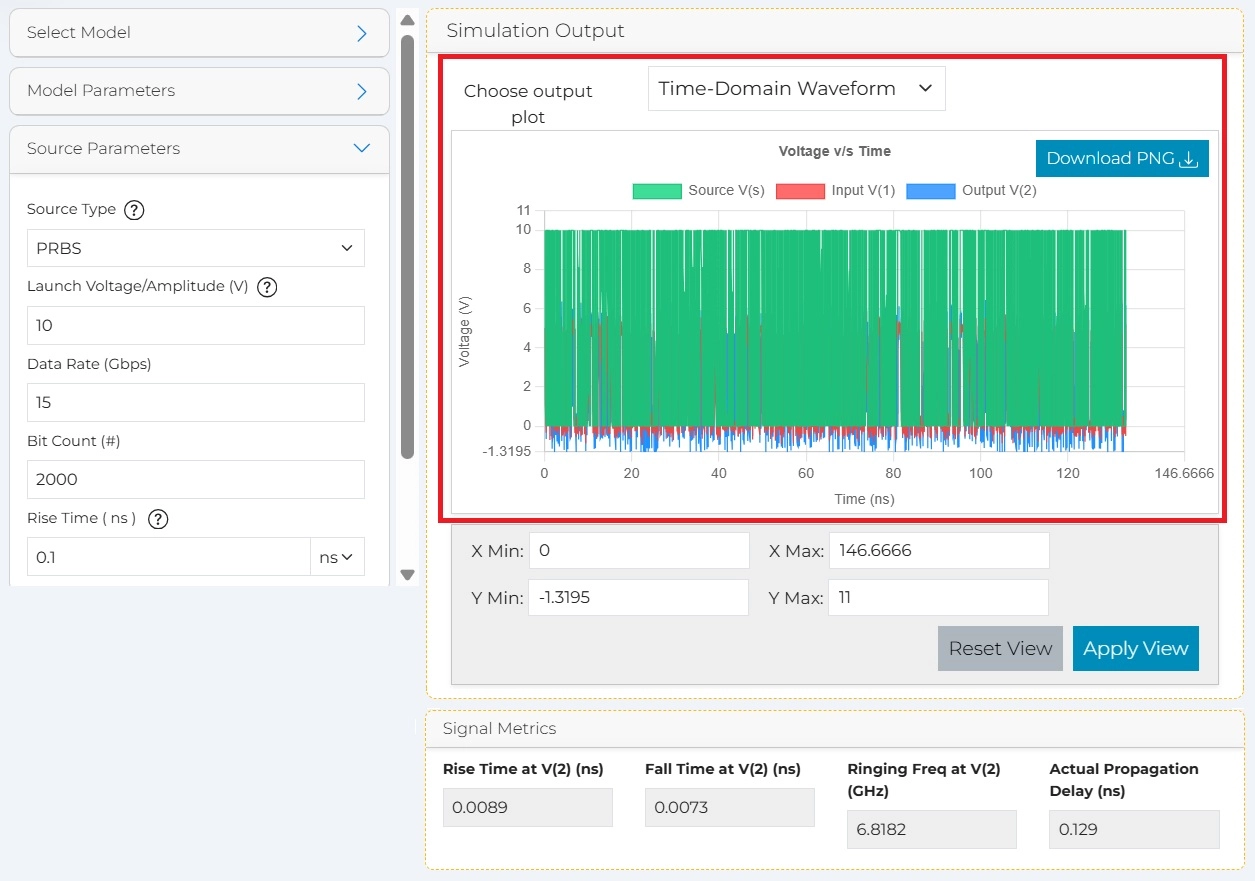
Transmission line model 3: Segmented Lossy (RLGC)
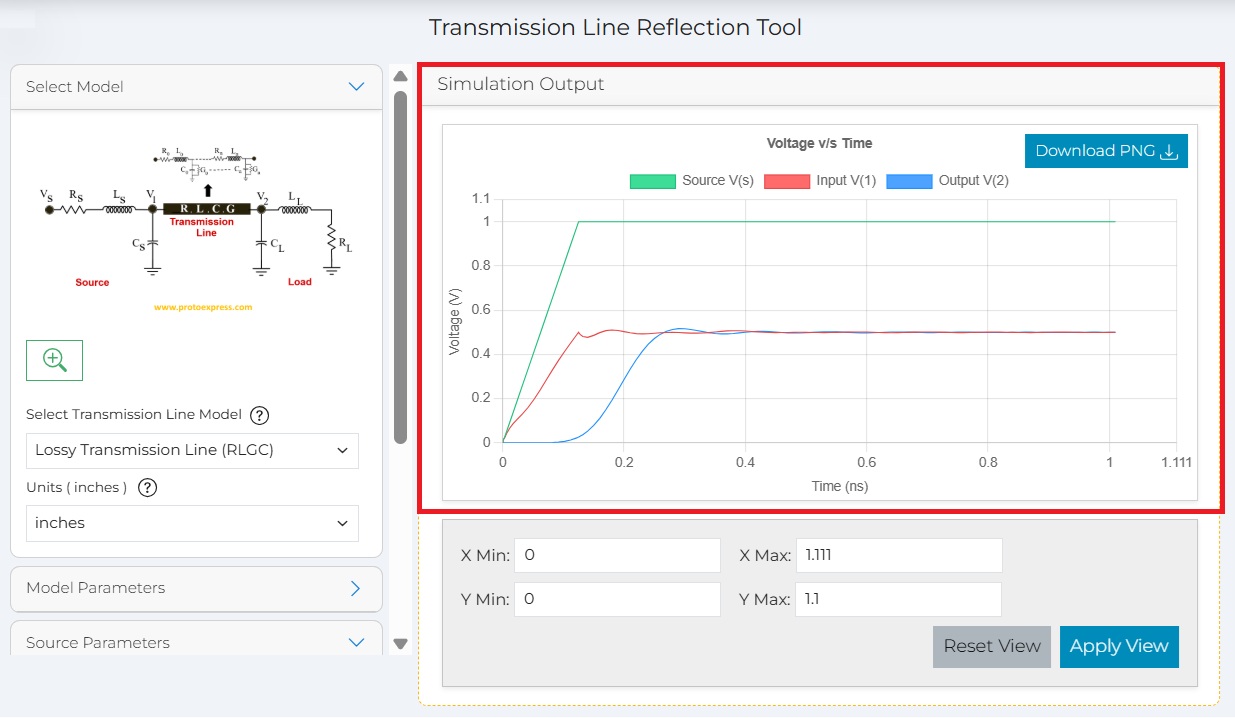
It is the most realistic model. This structure adds resistance and conductance to simulate signal attenuation (loss) and leakage over long trace lengths.
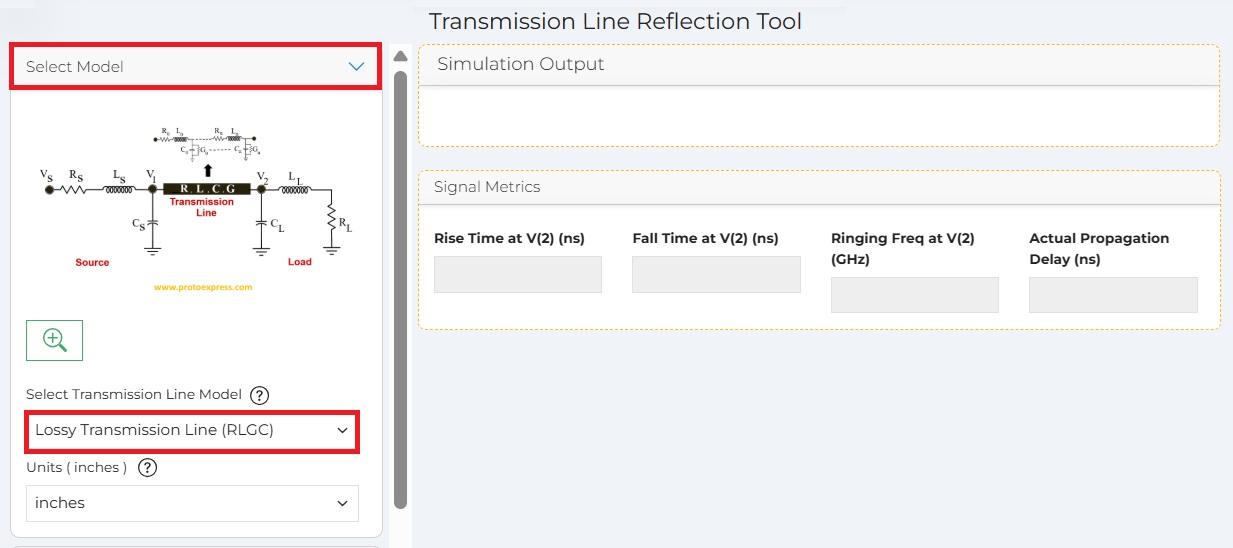
Step 1: Enter Resistance, Inductance, Conductance, Capacitance, and Total Length.
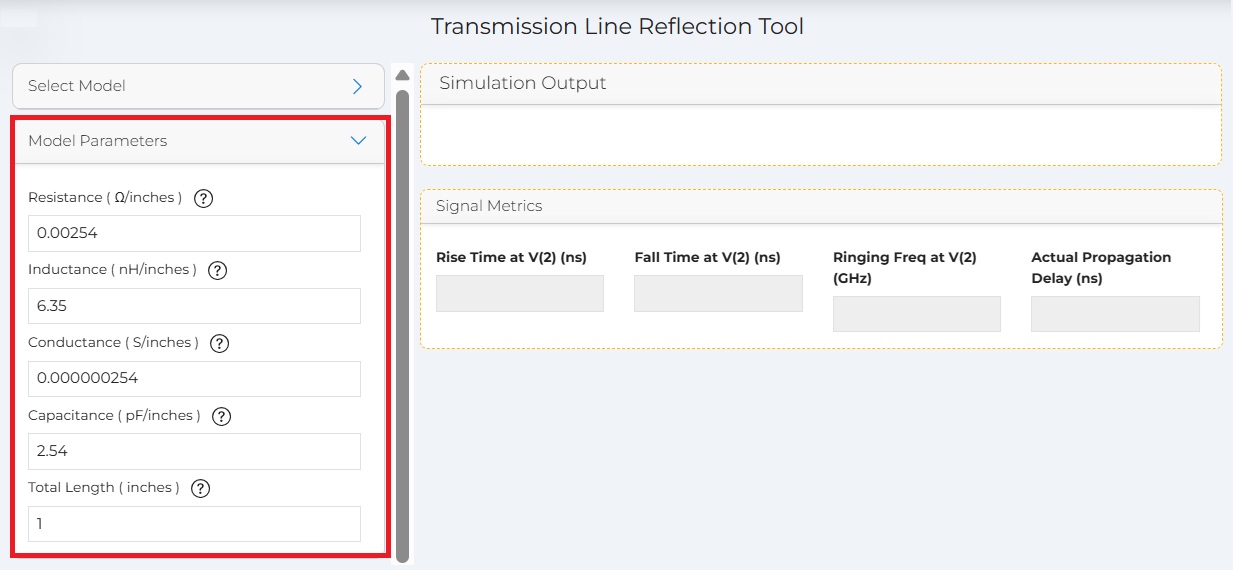
Step 2: Select the source type under the Source Parameters drop-down: Step (Single Pulse), Clock (Periodic), Sine, or PRBS (Pseudo-Random Bit Sequence).
- If you choose Step (Single Pulse), enter Launch Voltage/Amplitude and Rise Time.
- If you select Clock (Periodic), enter Launch Voltage/Amplitude, Frequency, Duty Cycle, and Rise/Fall Time.
- If you select Sine, enter Frequency, Rise Time, and Offset.
- If you select PBRS, enter Data Rate, Bit Count, and Rise Time.
Step 3: Provide Source Resistance (Rs), Source Inductance (Ls), Source Capacitance (Cs), Load Resistance (RI), Load Inductance (LI), and Load Capacitance (Cl), and click Simulate.
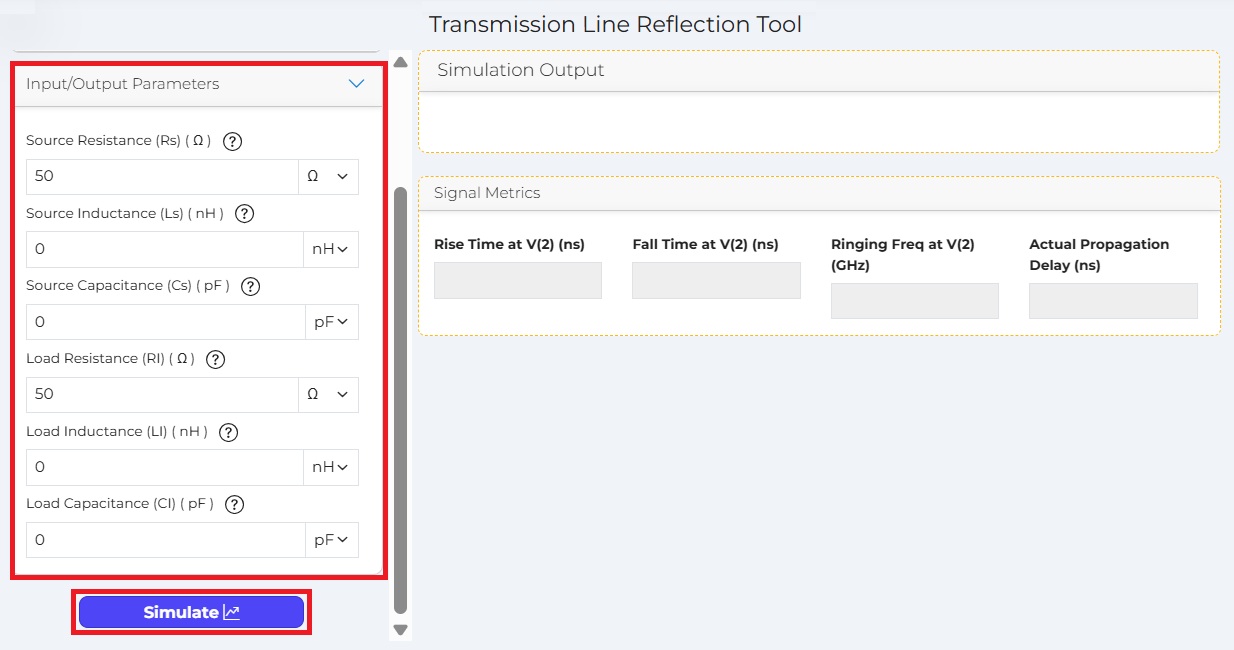
For Step, Clock (Periodic), and Sine source types, the tool displays the resulting output waveform.
For PRBS, the tool generates an eye diagram to evaluate signal integrity.
Use the Choose output plot dropdown to switch between the eye diagram and the time-domain waveform.
How to interpret the simulation outputs
The tool displays three key waveforms:
- Source V(s): The perfect signal generated inside the driver with no losses.
- Input V(1): The signal entering the transmission line. This reflects source impedance effects.
- Output V(2): The signal at the receiver, including all reflections, delays, and attenuation.
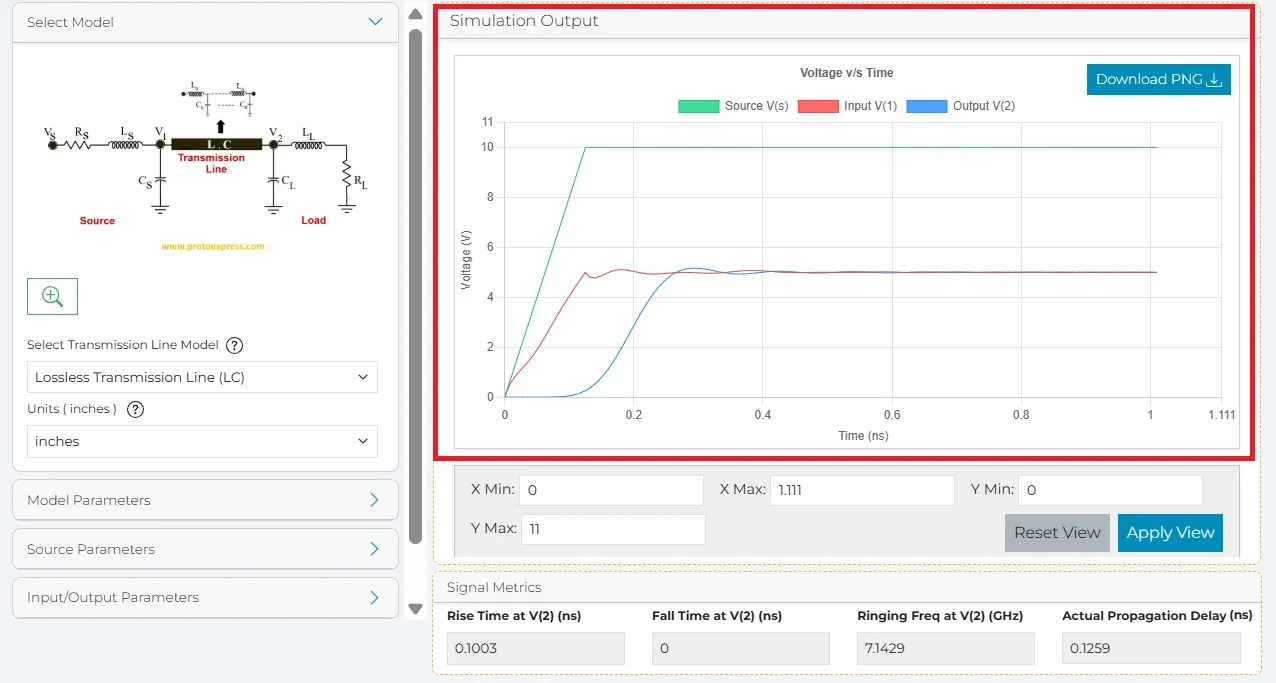
A clean output waveform indicates uniform impedance and effective termination. A distorted waveform (overshoot, undershoot, ringing, or slow edges) reflects signal integrity issues.
In addition to the waveforms, the tool automatically computes:
- Rise/fall time at v(2): Indicates signal degradation due to loading and parasitics.
- Ringing frequency at v(2): Identifies oscillations caused by impedance mismatch.
- Actual propagation delay: Measures signal travel time from source to load.
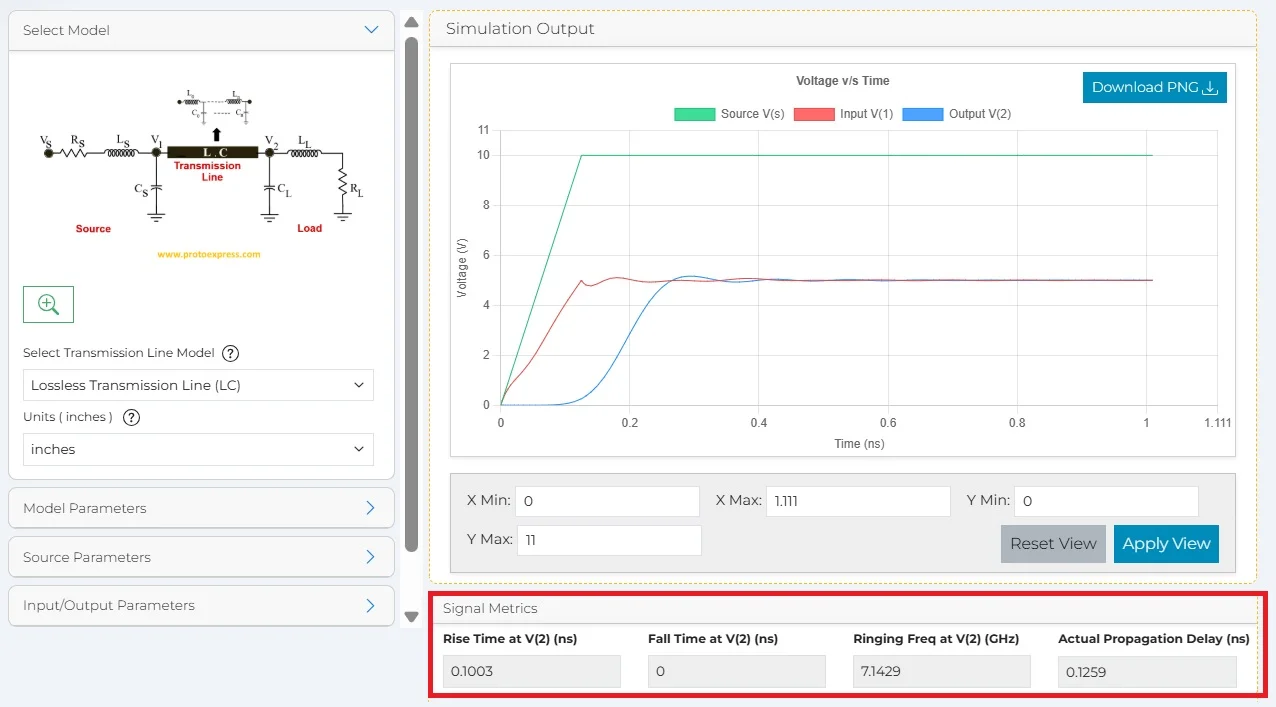
These metrics help validate timing and signal integrity requirements.
For a quick, preliminary assessment of voltage reflections, try our Transmission Line Reflection Calculator. It uses an ideal transmission-line model to calculate incident, reflected, and output voltages at different time intervals, helping you understand the effects of impedance mismatches without accounting for parasitic effects or transmission-line losses.
The table below summarizes the differences.
| Feature | Transmission Line Reflection Calculator | Transmission Line Reflection Simulator |
|---|---|---|
| What it does | Calculates voltage changes caused by signal reflections along a transmission line | Simulates signal behavior to analyze reflections, ringing, propagation delay, and other signal integrity effects |
| Transmission-line models | Ideal transmission line, assuming no losses or parasitic effects | Realistic transmission-line behavior, including ideal, lossless LC, and lossy RLGC characteristics |
| Output | Incident, reflected, and output voltage values at different time intervals | Time-domain waveforms and eye diagrams, with measurements such as rise/fall time and ringing frequency |
| When to use | At the initial design phase and preliminary signal-integrity checks, typically before PCB routing, to estimate voltage reflections caused by impedance mismatches | During detailed signal-integrity analysis to evaluate transmission-line behavior, parasitic effects, ringing, and eye diagrams |
The Transmission Line Reflection Simulator enables accurate prediction of signal behavior in high-speed PCB designs. By combining SPICE-based simulation with parameter customization, the tool helps you identify reflection issues, optimize termination, and ensure reliable signal transmission. Use this tool to reduce design iterations, improve signal integrity, and build robust high-speed systems.
Watch the demo:

Sierra Circuits has developed easy-to-use tools for PCB designers and Electrical Engineers at every stage of circuit board development.



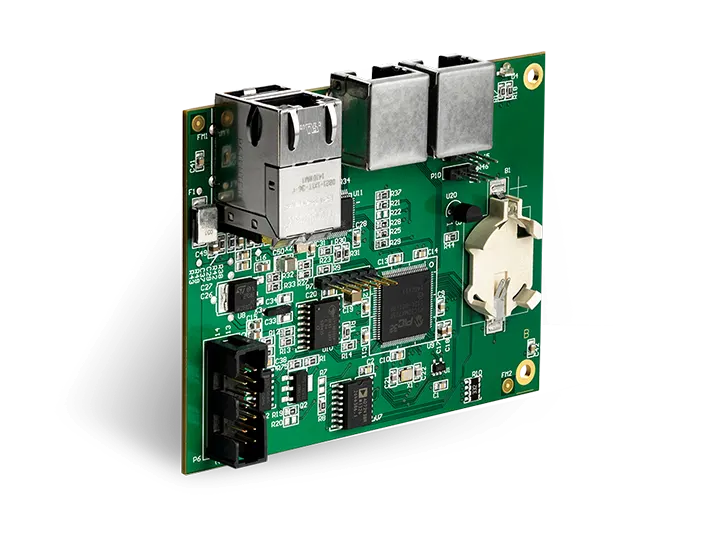
Fabrication, Procurement, & Assembly. PCBs fully assembled in as fast as 5 days.
- Bundled together in an entirely-online process
- Reviewed and tested by Engineers
- DFA & DFM Checks on every order
- Shipped from Silicon Valley in as fast as 5 days
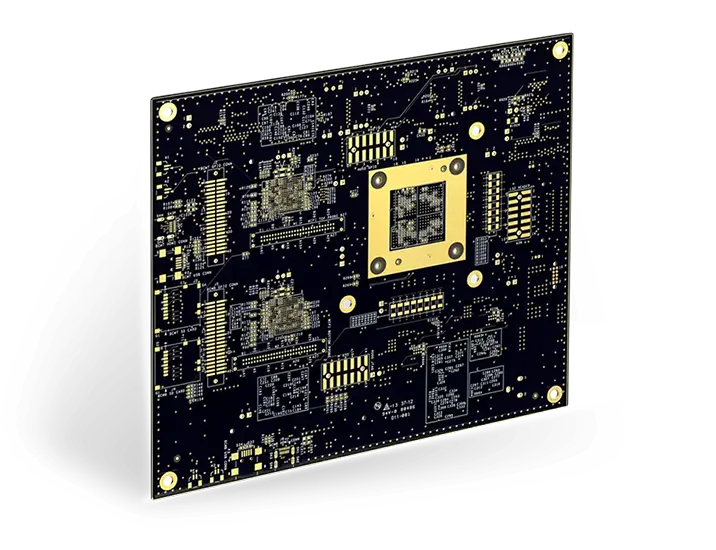
Fabrication. Procurement & Assembly optional. Flexible and transparent for advanced creators.
- Rigid PCBs, built to IPC-6012 Class 2 Specs
- 2 mil (0.002″) trace / space
- DFM Checks on every order
- 24-hour turn-times available
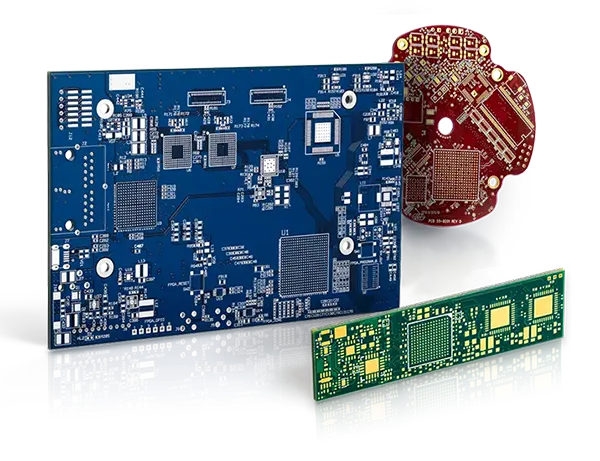
Complex technology, with a dedicated CAM Engineer. Stack-up assistance included.
- Complex PCB requirements
- Mil-Spec & Class 3 with HDI Features
- Blind & Buried Vias
- Flex & Rigid-Flex boards